- MQL5 66%
- MQL4 21.5%
- Python 12.5%
| Filename | Latest commit message | Latest commit date |
|---|---|---|
|
|
||
| docs | ||
| LICENSES | ||
| mql4 | ||
| mql5 | ||
| tests | ||
| .gitignore | ||
| LICENSE | ||
| README.md | ||
| requirements.txt | ||

SuperTrend Signal Alerts (MetaTrader 5 and MetaTrader 4)
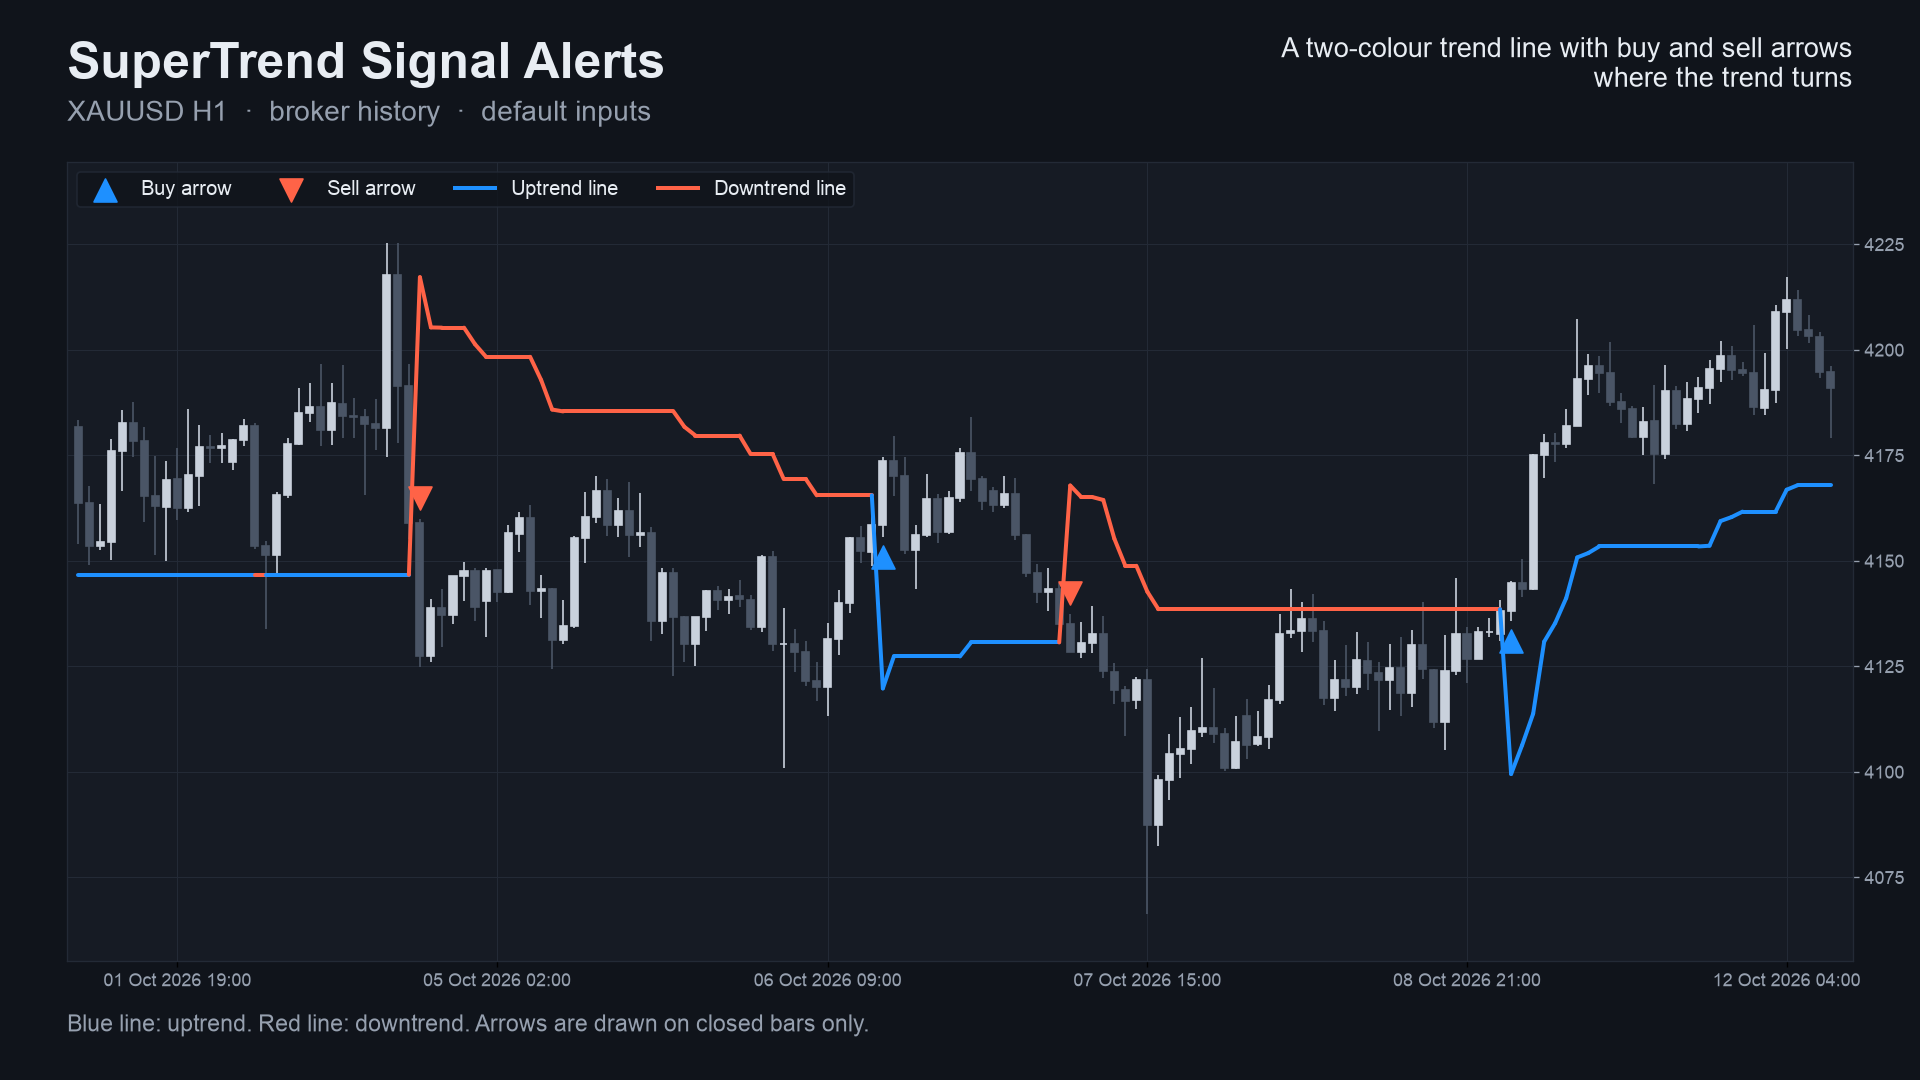
A free SuperTrend indicator that draws a two-colour trend line and one buy or sell arrow per trend flip, on closed bars only, and sends an alert for each arrow. Optional EMA and RSI filters apply to the arrows and alerts. Source for both editions, a Python reference of the maths, and the tests that were used to check that the MT5 and MT4 code, the Python reference and each other all agree.
Website: allanninal.dev/mql5 (indicators) · MT4 editions · allanninal.dev · Contact: message me on LinkedIn.
It is an indicator, not a strategy. It draws a line and arrows and places no trades. Nothing here is a profit claim (see Honest limits).
Get it on the MQL5 Market
| Edition | Platform | Price | Link |
|---|---|---|---|
| SuperTrend Signal Alerts | MT5 | free | https://www.mql5.com/en/market/product/201882 |
| SuperTrend Signal Alerts MT4 | MT4 | free | https://www.mql5.com/en/market/product/202324 |
The Market builds are the same calculation as the source in this repository. There is no paid edition of this indicator: what you see here is the whole product.
Contents
- What it is and who it is for
- Why it was built
- How it works
- Non-repainting: the proof and how it was tested
- Architecture and buffers
- Inputs, alerts, install and compile
- Run the Python reference and the tests
- Honest limits
- Free, with no paid edition
- Licence and credits
What it is and who it is for
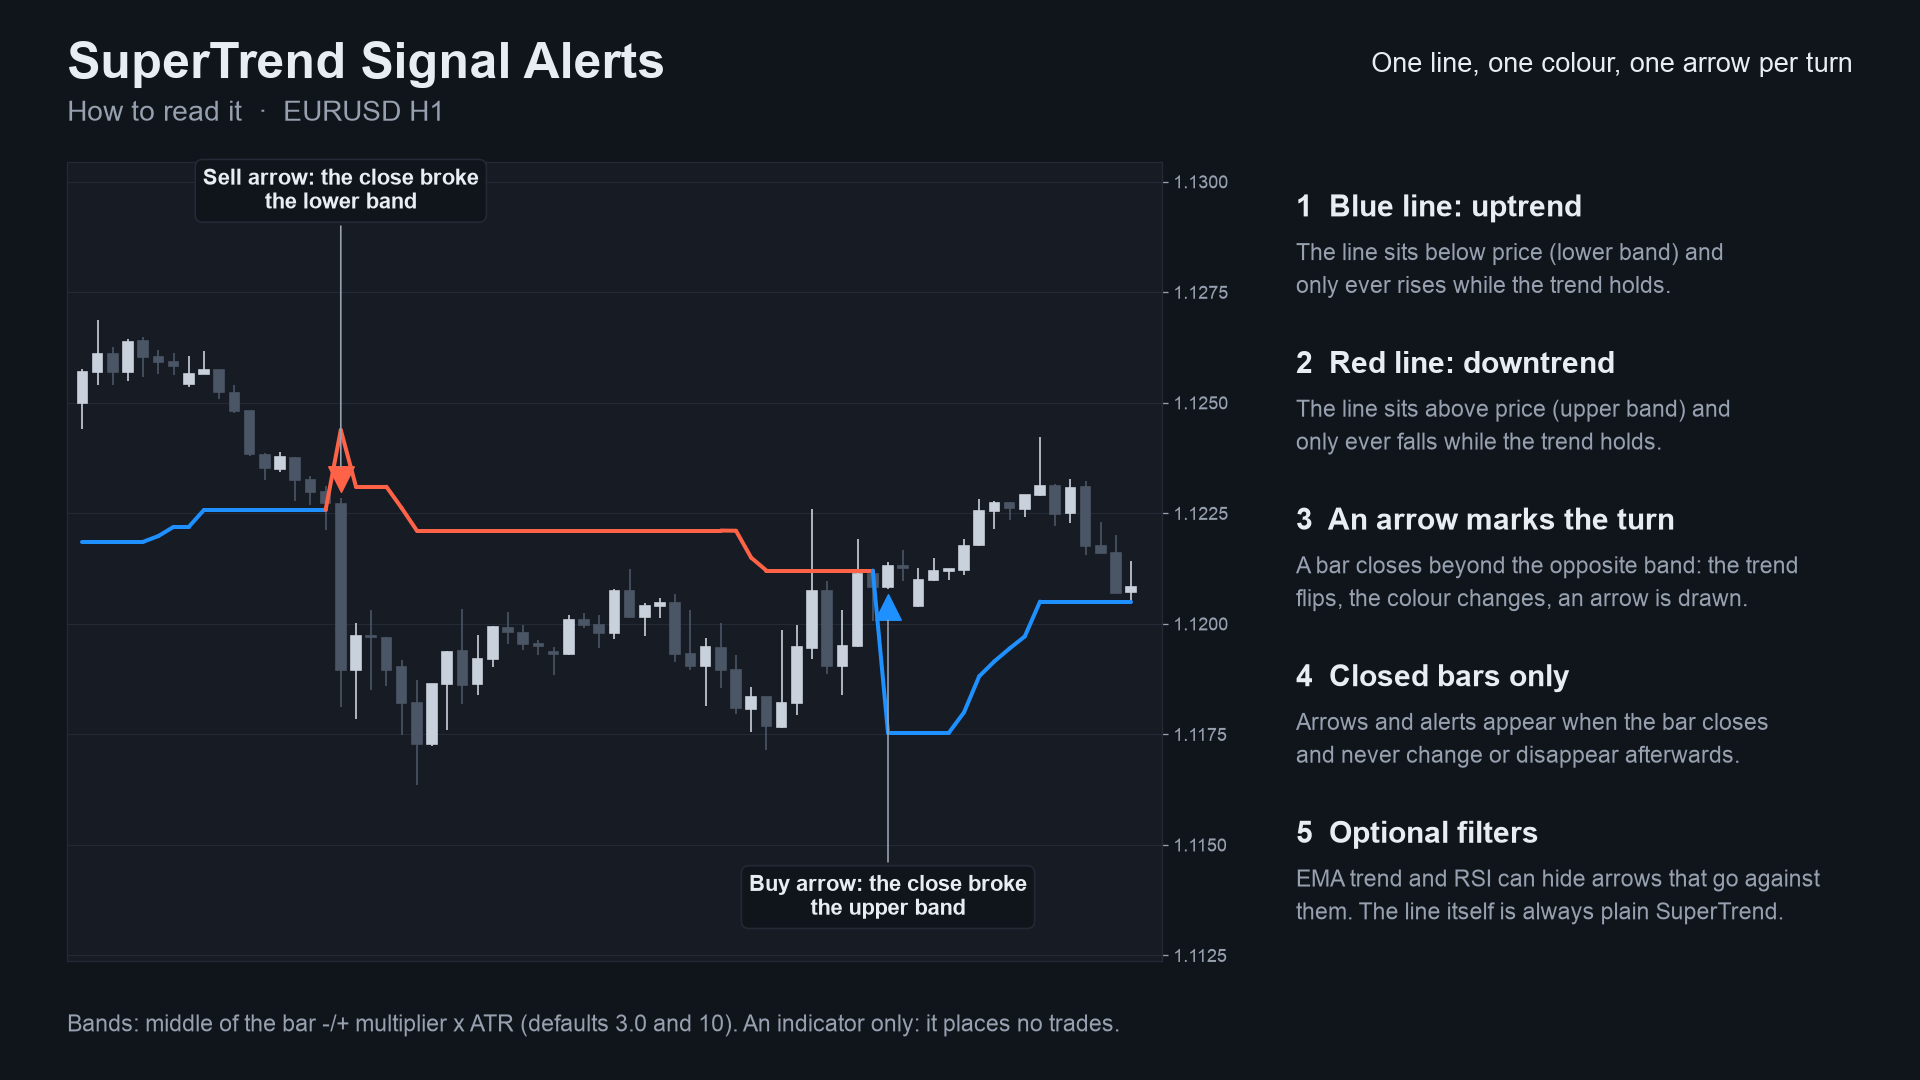
What: the SuperTrend method as a native MetaTrader indicator. Two bands sit multiplier x ATR above and below the
bar's middle price and only ratchet in the direction of the trend. While price closes on one side, the line follows the
band on that side. When a close breaks the opposite band the trend flips, the line jumps to the other band, and you get an
arrow (buy below the candle, sell above) and an alert (pop-up, sound, push, e-mail). Two optional filters on the arrows and
alerts: close above or below an EMA, and RSI above or below 50.
For: traders who follow trends and want the flip points marked on any symbol and timeframe, and who want to know that
the arrow they saw will still be there tomorrow. Also for developers who want a small, tested indicator with documented
buffers to read from an EA with iCustom.
Not for: anyone who expects early entries. A trend-following line turns after the move has started, and in sideways markets it can flip often.
 |
 |
 |
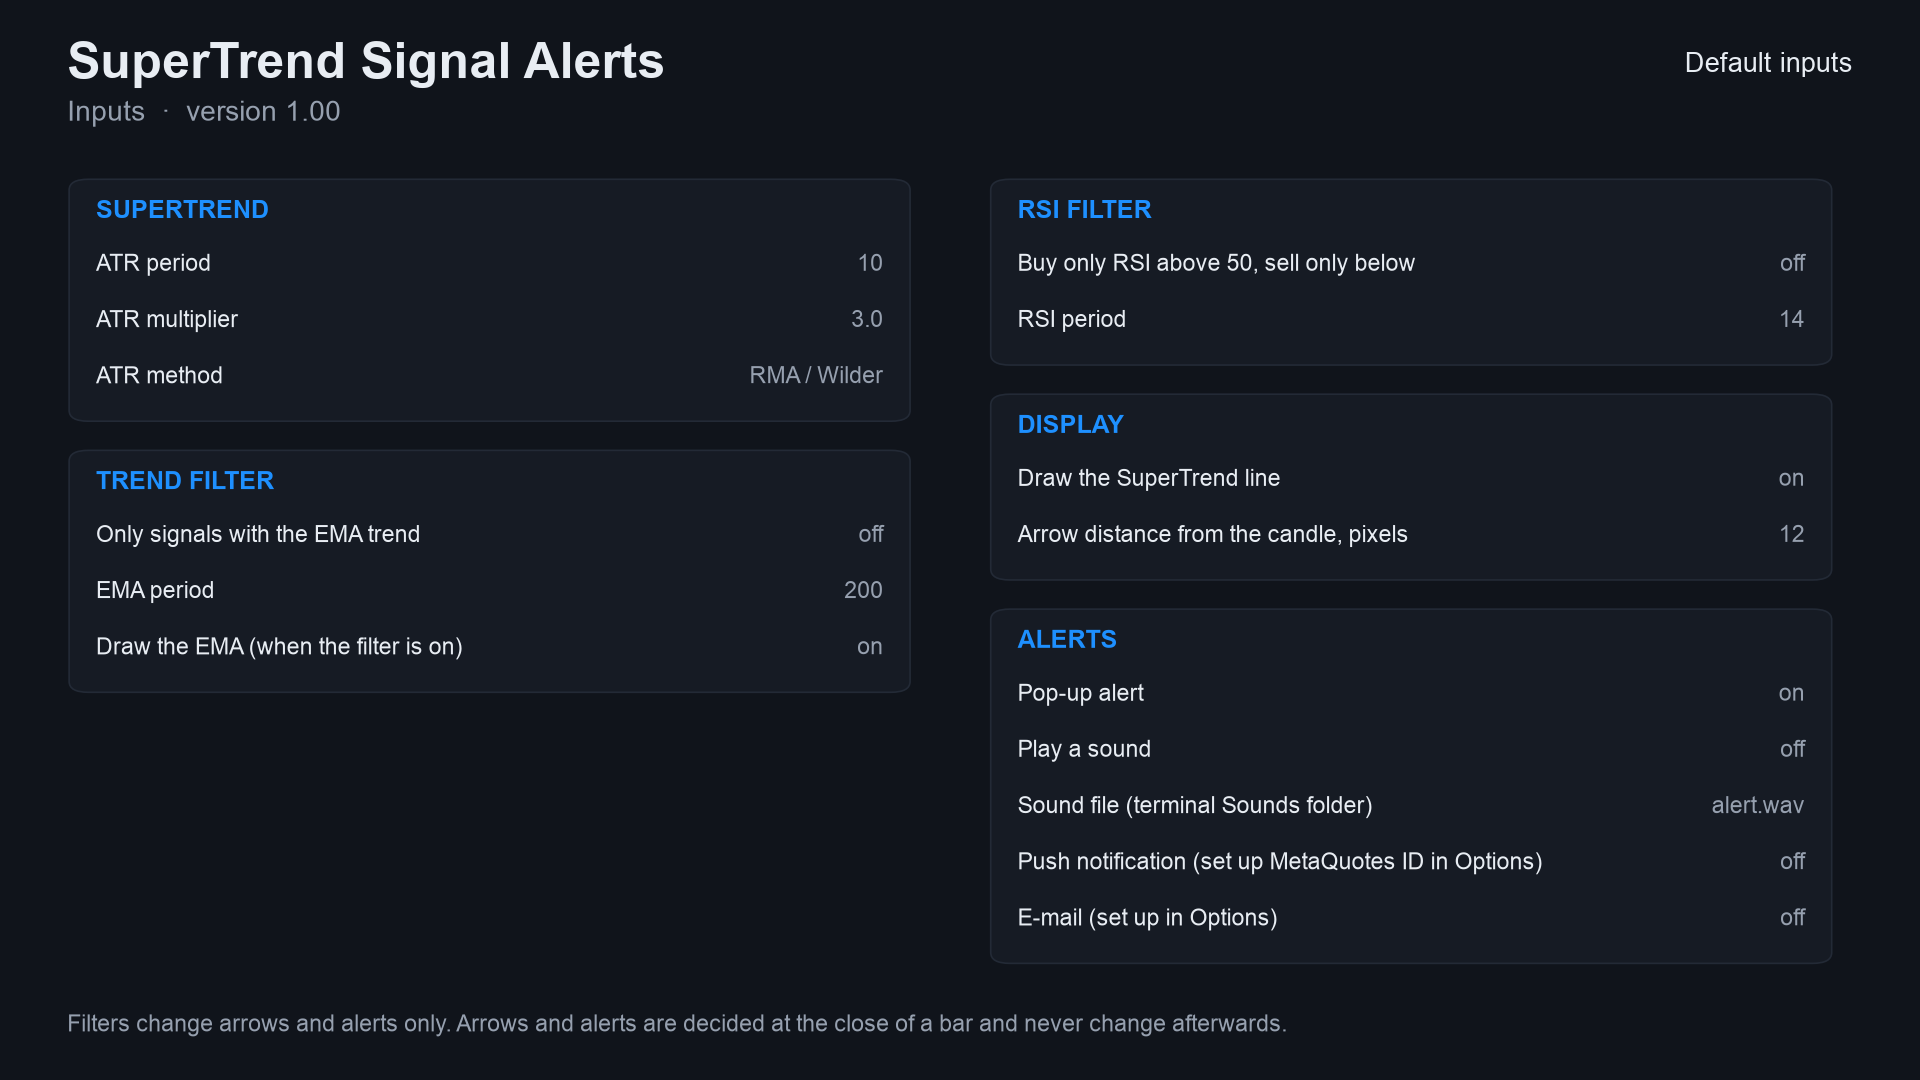 |
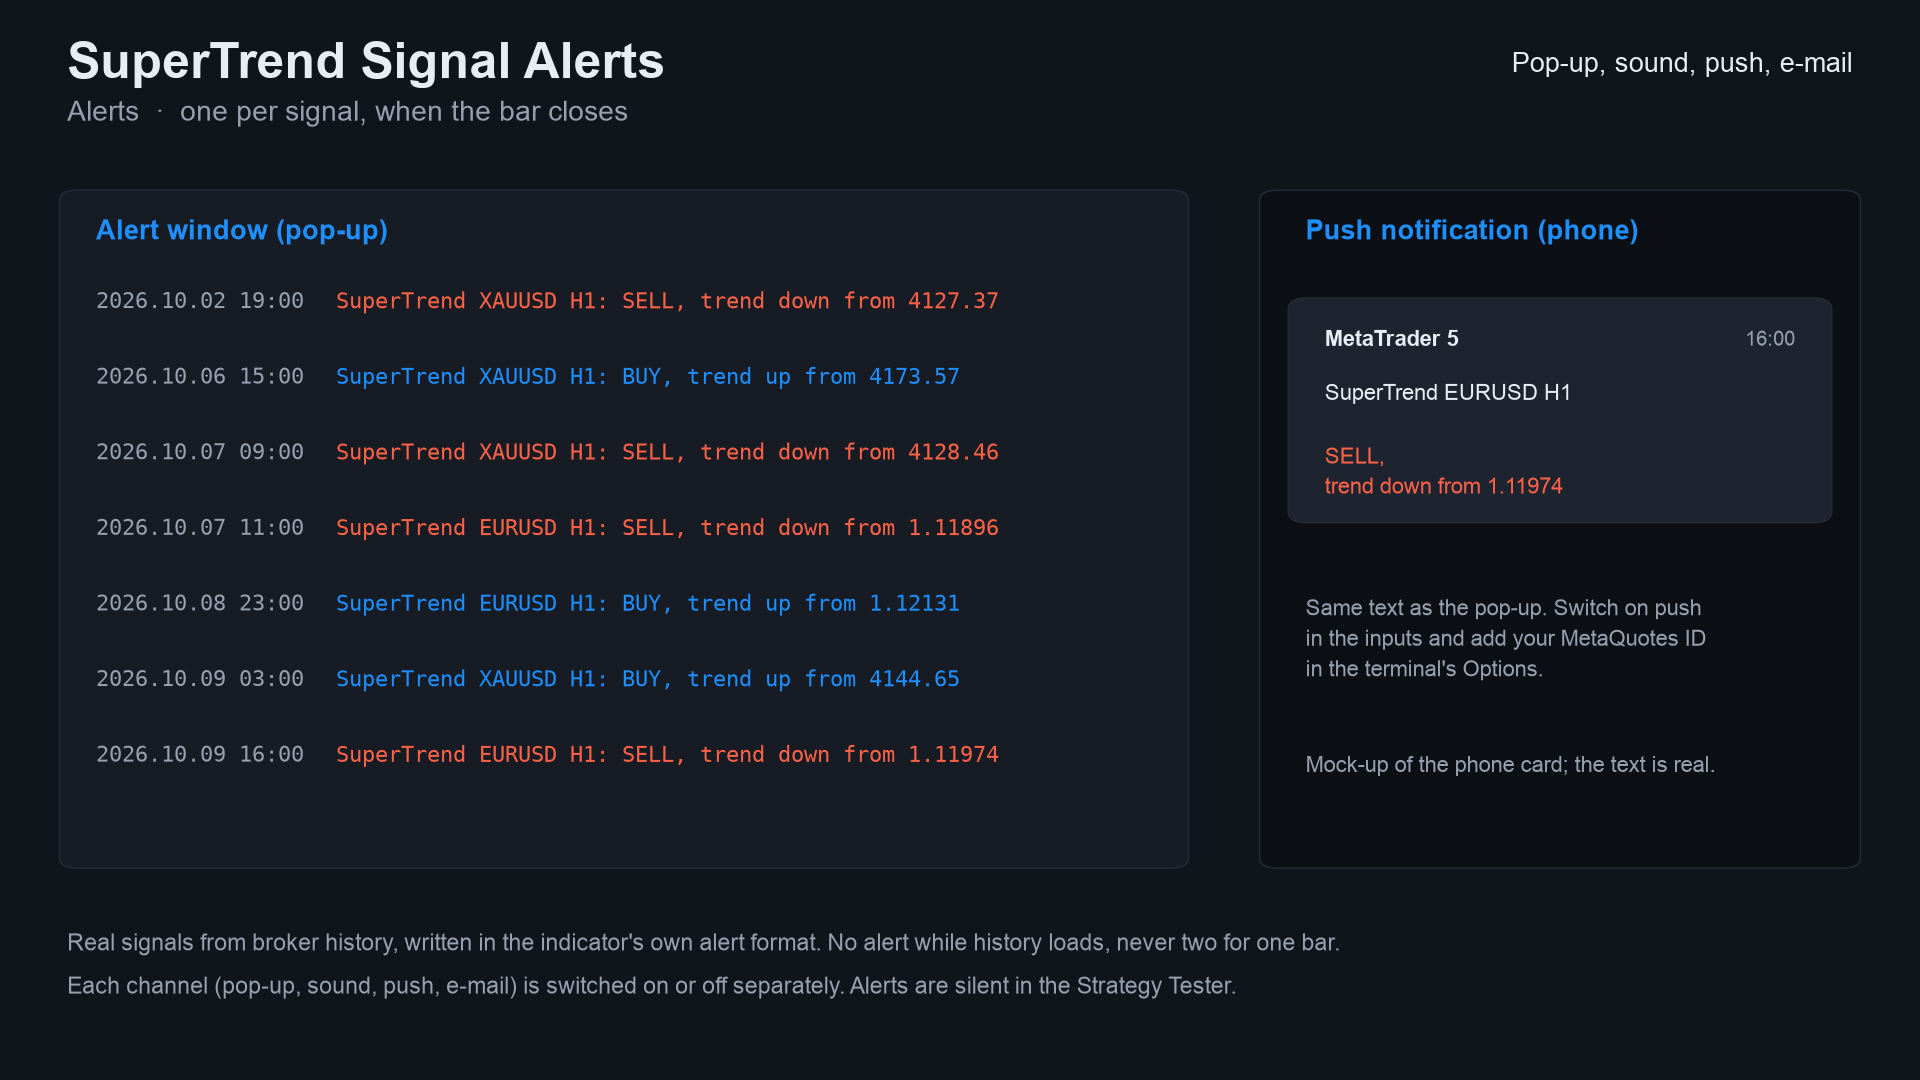
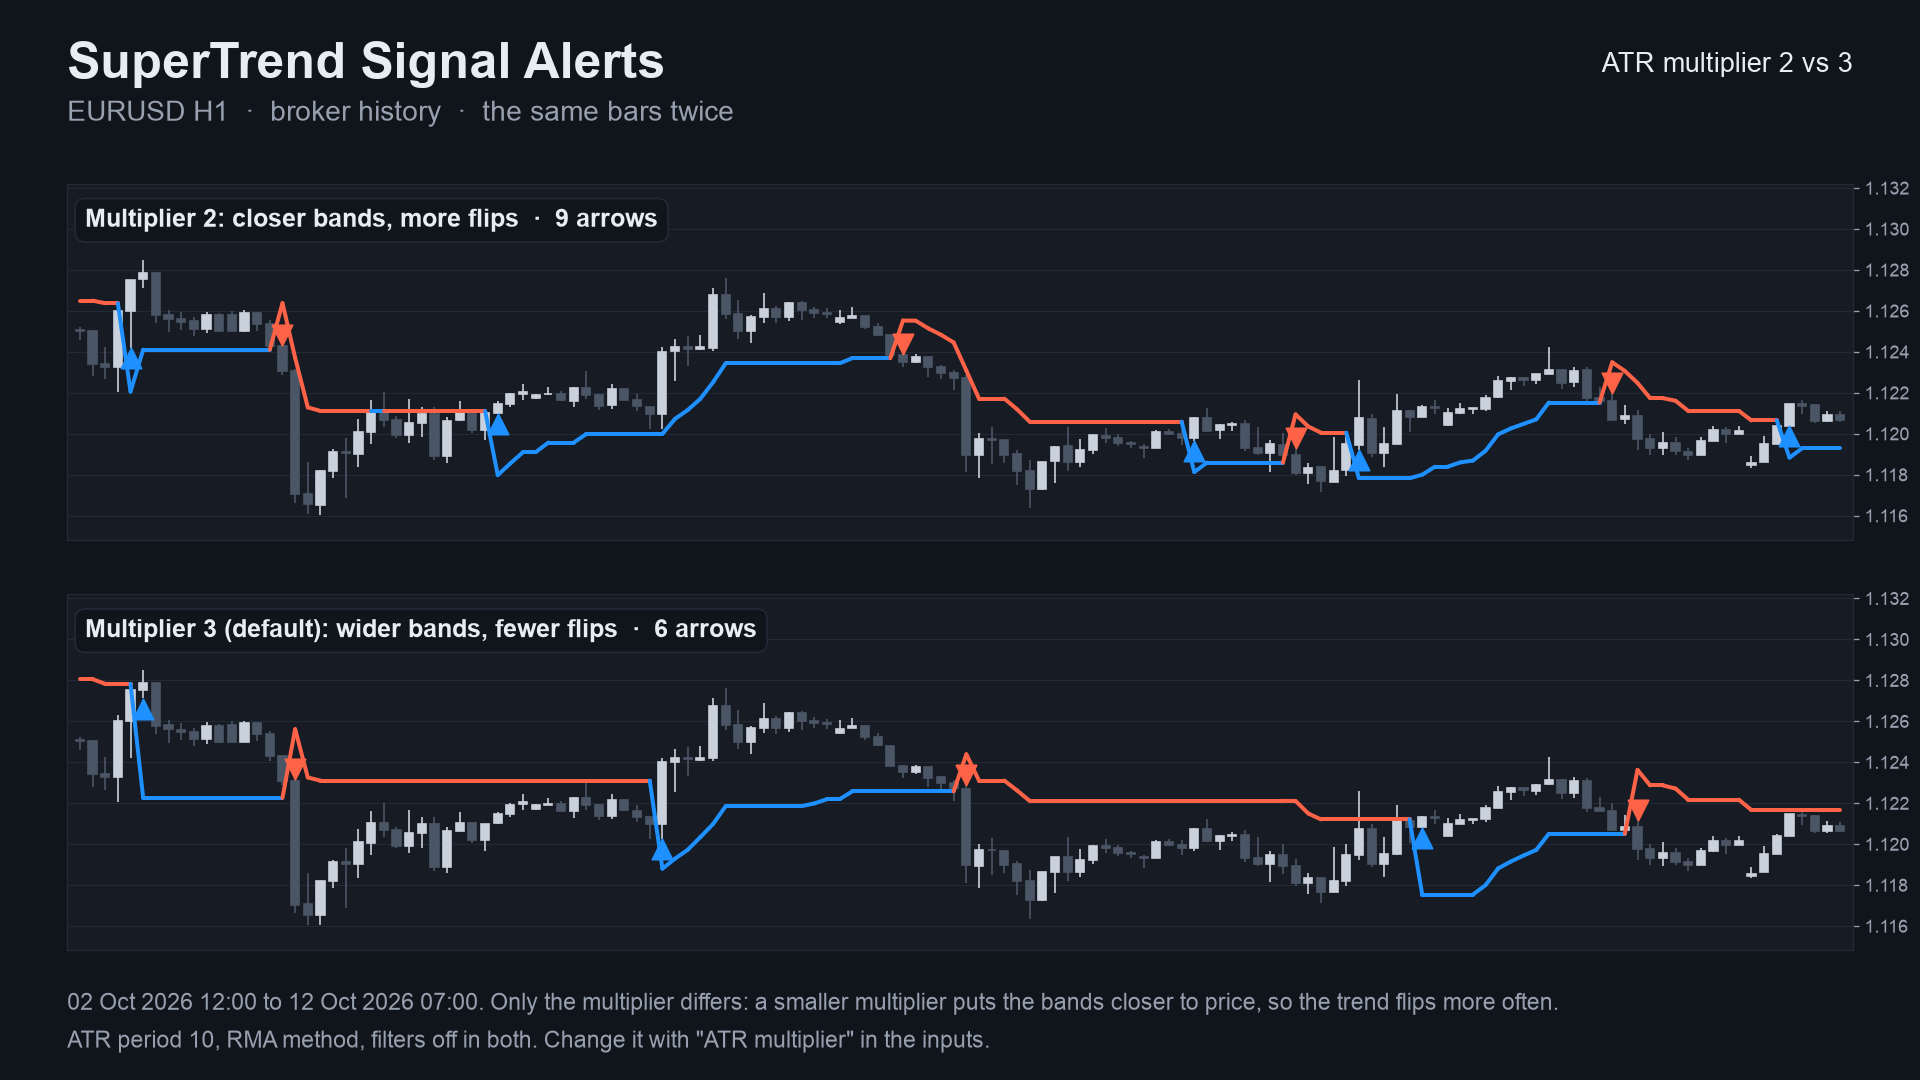
Image notes: charts 01-03 are drawn by the Python reference on broker history (the same numbers the indicator shows); the
alert text on 06 is the indicator's real text but the pop-up and phone card around it are mock-ups; the Data Window panel
on 08 is a mock-up of the buffer map. They are illustrations, not terminal captures. MT4 versions are in
docs/images/mt4/.
Why it was built
SuperTrend is one of the most widely used trend lines on TradingView, and traders who move to MetaTrader ask for it. The motivations, stated with the evidence we actually have:
- A native, readable port. The method is a few lines of arithmetic and does not need a closed-source box.
- Trust in the arrows. Our market research (demand scan of MQL5 Market, forums and freelance boards, October 2026) found repeated complaints about arrow indicators that repaint, and a 2026-07 request for "arrows confirmed on bar close". The design rule follows: an arrow is only drawn on a bar that has closed, and never moves afterwards.
- Honest scale of demand. The same research found that named classic indicators such as SuperTrend are requested only rarely by name (14 freelance requests in the board we counted, against several hundred for custom strategy work). So this is a free tool that gives a clean reference implementation and builds a track record, not a claim of mass demand.
- Provable behaviour. Every number in this README comes from an executed check, listed below, not from a promise.
mindmap
  root((SuperTrend Signal Alerts))
    Problem
      TradingView indicator, no clean MetaTrader port
      Arrow indicators that repaint
      Alerts that fire twice or during history load
    Design rules
      Signals on closed bars only
      One alert per bar
      Same maths on MT5 MT4 and Python
    Proof
      Python reference
      Bar by bar parity
      Tester repaint probe
      Market validation
How it works
The maths, step by step
Let O, H, L, C be the bar's open, high, low, close, i the bar index (oldest = 0), n the ATR period and m the
multiplier.
-
True range
TR[i] = max(H[i]-L[i], |H[i]-C[i-1]|, |L[i]-C[i-1]|), andTR[0] = H[0]-L[0]. -
ATR, one of two methods (input ATR method):
- RMA / Wilder (default, same as
ta.atron TradingView):ATR[n-1] = mean(TR[0..n-1]), thenATR[i] = (ATR[i-1] * (n-1) + TR[i]) / n. - SMA of the true range:
ATR[i] = mean(TR[i-n+1..i]).
- RMA / Wilder (default, same as
-
Source
src[i] = (H[i] + L[i]) / 2. -
Raw bands
up = src - m * ATR[i]anddn = src + m * ATR[i]. Letup1anddn1be the previous bar's final bands (on the first bar, the bar's own). -
Ratchet (the bands only move with the trend):
- if
C[i-1] > up1:up = max(up, up1)(the lower band only rises) - if
C[i-1] < dn1:dn = min(dn, dn1)(the upper band only falls)
- if
-
Trend
trend[i], starting at+1:- if
trend = -1andC[i] > dn1:trend = +1 - if
trend = +1andC[i] < up1:trend = -1 - otherwise unchanged
- if
-
Line
line[i] = upwhentrend = +1, elsedn. Blue in an uptrend, red in a downtrend. -
Signals (on closed bars only):
- Buy:
trend[i] = +1andtrend[i-1] = -1 - Sell:
trend[i] = -1andtrend[i-1] = +1 - EMA filter: a buy also needs
C[i] > EMA[i], a sellC[i] < EMA[i], whereEMAis seeded with the average of the firstpcloses and thenEMA[i] = EMA[i-1] + 2/(p+1) * (C[i] - EMA[i-1]). - RSI filter: a buy also needs
RSI[i] > 50, a sellRSI[i] < 50, with Wilder's RSI (gains and losses smoothed with the same seeded RMA).
- Buy:
A comparison "close above band" ignores floating-point noise below 1e-10 of the band, in the indicator and in the
Python reference alike: a band can tie a close exactly in real arithmetic, and a last-bit difference would otherwise
decide a trend flip differently in two languages. The filters change arrows and alerts only, not the line. The live bar's
line may move; arrows are never drawn on it.
Per-bar algorithm
flowchart TD
    A[New or updated bar i] --> B[src = high + low / 2]
    B --> C[True range, then ATR: Wilder RMA or SMA]
    C --> D{ATR available? i >= n-1}
    D -- no --> Z[No line, no arrow]
    D -- yes --> E[up = src - m x ATR, dn = src + m x ATR]
    E --> F[Ratchet: up only rises while the last close was above it<br/>dn only falls while the last close was below it]
    F --> G{trend = down and close > previous dn?}
    G -- yes --> H[trend = up]
    G -- no --> I{trend = up and close < previous up?}
    I -- yes --> J[trend = down]
    I -- no --> K[trend unchanged]
    H --> L[Line = up band, blue]
    J --> M[Line = dn band, red]
    K --> N[Line = band of the current trend]
    L --> O{Bar is closed and trend just flipped?}
    M --> O
    N --> O
    O -- no --> Z2[Line only, no arrow, no alert]
    O -- yes --> P{EMA and RSI filters pass?}
    P -- no --> Z2
    P -- yes --> Q[Arrow on the bar]
    Q --> R[Alert, once per bar, only when live]
Signal states
stateDiagram-v2
    [*] --> Warmup
    Warmup --> Uptrend: ATR ready, first bar trend is up
    Uptrend --> Uptrend: close stays above the lower band, band only rises
    Downtrend --> Downtrend: close stays below the upper band, band only falls
    Uptrend --> Downtrend: closed bar breaks the lower band (sell arrow, alert)
    Downtrend --> Uptrend: closed bar breaks the upper band (buy arrow, alert)
    Uptrend --> Downtrend: flip suppressed by a filter (line flips, no arrow)
    Downtrend --> Uptrend: flip suppressed by a filter (line flips, no arrow)
Alert flow
sequenceDiagram
    participant T as Terminal
    participant I as SuperTrend indicator
    participant H as Alert helper
    participant U as You
    T->>I: OnCalculate (history load, prev_calculated = 0)
    I->>H: signal on last closed bar? live = false
    H-->>I: ignored (never alert during history load)
    T->>I: OnCalculate (new bar closes, prev_calculated > 0)
    I->>I: recompute last bars, test the bar that just closed
    I->>H: SignalAlert(text, bar time, live = true)
    alt bar time is newer than the last alert and not in the tester
        H->>U: pop-up (optional sound, push, e-mail)
    else same bar again or tester run
        H-->>I: nothing sent
    end
What the multiplier does (measured)
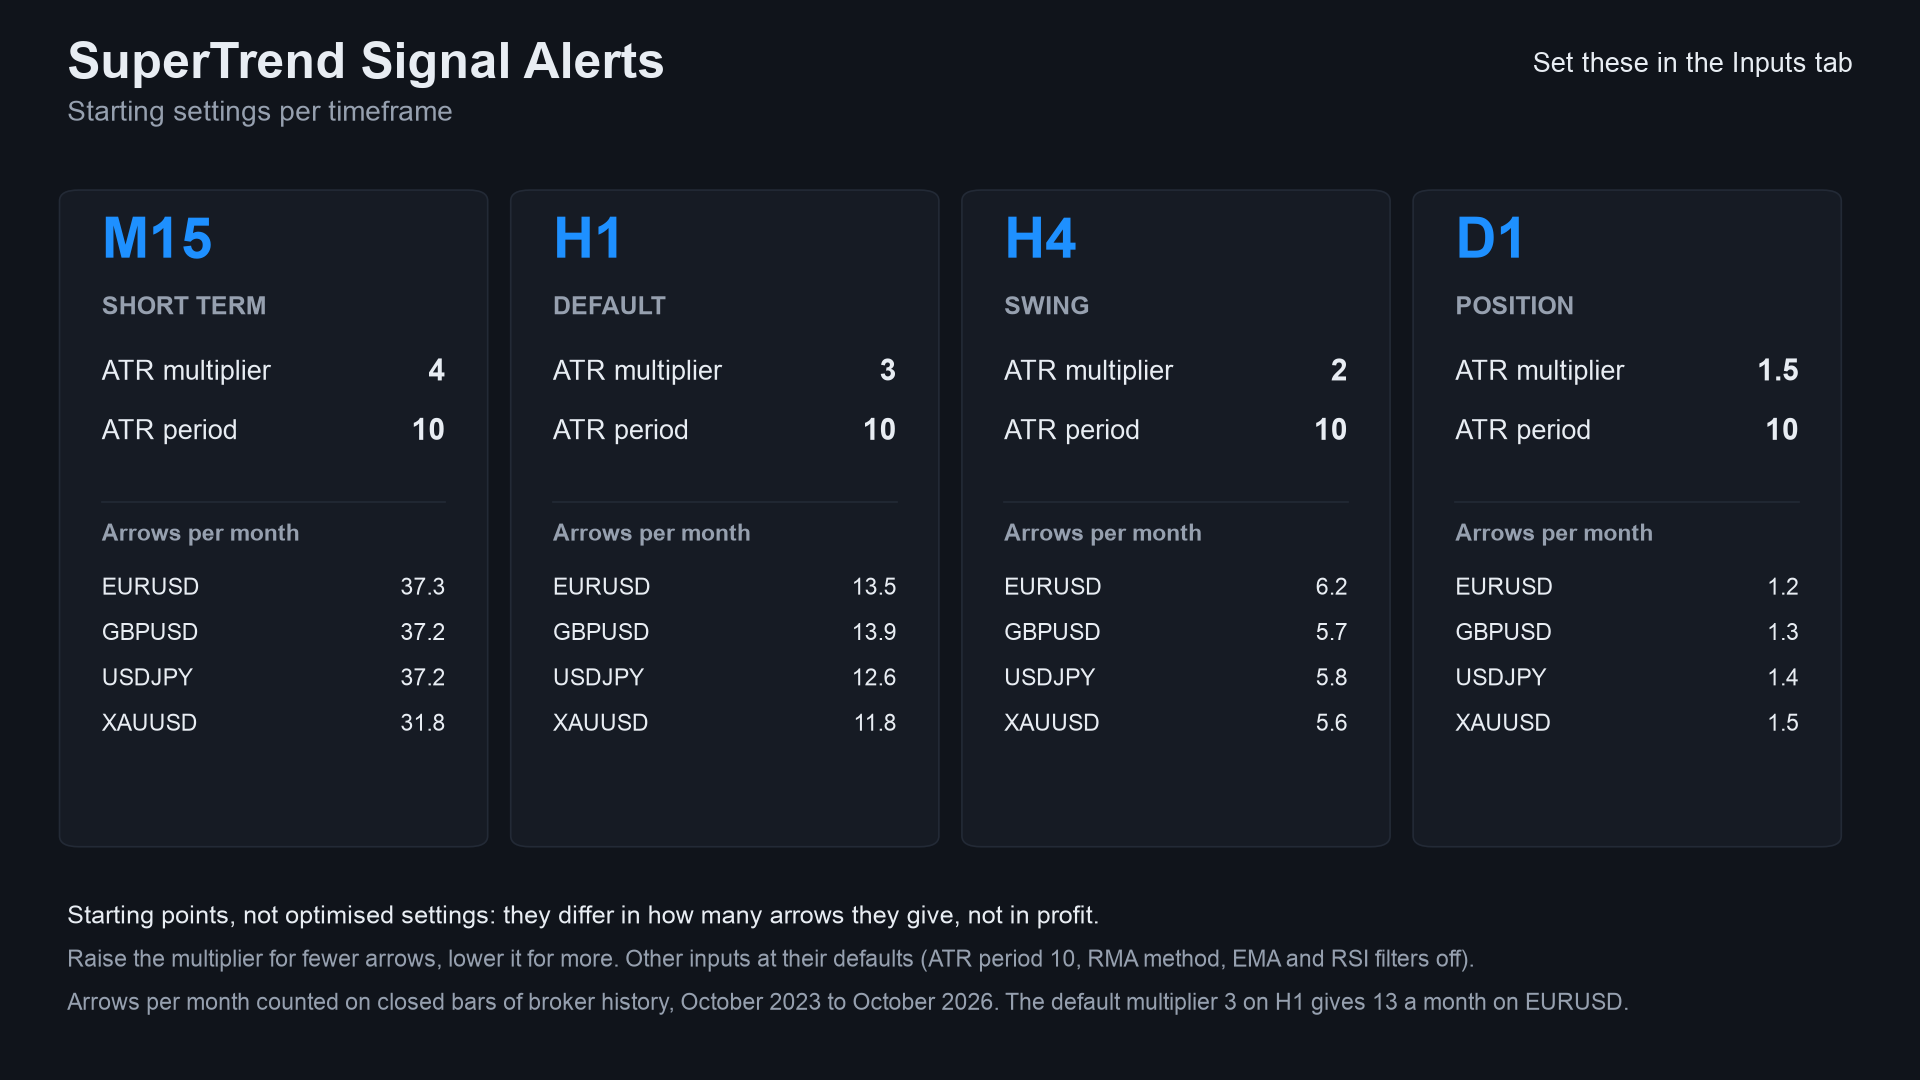
A larger multiplier puts the bands further from price, so the trend flips later and less often. Arrows (buy plus sell) per
month on closed bars of broker history, 2023-10-01 to 2026-10-12 (36.3 months), ATR period 10, other inputs default.
Source: docs/data/arrows-per-month.json. This counts arrows only. It says nothing about
profit.
xychart-beta
    title "H1 arrows per month by multiplier (EURUSD and XAUUSD)"
    x-axis ["1.5", "2.0", "2.5", "3.0", "4.0", "5.0"]
    y-axis "arrows per month" 0 --> 40
    line [33.3, 23.67, 17.61, 13.46, 8.94, 6.47]
    line [30.66, 21.63, 15.47, 11.78, 8.31, 5.94]
First line EURUSD, second XAUUSD.
xychart-beta
    title "Arrows per month by timeframe, multiplier 3.0 (XAUUSD)"
    x-axis ["M15", "H1", "H4", "D1"]
    y-axis "arrows per month" 0 --> 60
    bar [49.23, 11.78, 2.75, 0.47]
Non-repainting: the proof and how it was tested
"Non-repainting" is easy to claim. Here is what was actually run. Raw result files are in tests/results/.
1. Three implementations, compared bar by bar. The Python reference
(tests/reference.py) was written from the TradingView script's behaviour, not translated from the
MQL code. The MT5 and MT4 indicators were then dumped bar by bar (line, buy, sell buffers) in the MetaTrader Strategy
Tester, and tests/check_parity.py compared each dump with the reference. Pass means: every
closed bar's line within 1e-9 relative, and arrows on exactly the same bars.
| MT5 | MT4 | |
|---|---|---|
| dumps compared | 36 (4 symbols x M15/H1/H4 x 3 input sets) | 37 (same 36 + one every-tick EURUSD H1) |
| bars compared | 1,122,870 | 761,453 |
| arrows compared (buy + sell) | 30,823 | 22,525 |
| result | ALL PASS | ALL PASS |
Symbols: EURUSD, XAUUSD, GBPJPY, BTCUSD. Input sets: defaults; SMA ATR method with multiplier 2 and period 14; EMA and RSI
filters on. Source: tests/results/parity-mt5-and-mt4.txt. The MT5 M15 dumps cover
only 4,450 bars each (a short test history), and the MT4 test history is shorter on the FX pairs, which is why the bar
counts differ.
xychart-beta
    title "Arrows compared, Python vs indicator (all 0 differences)"
    x-axis ["Defaults MT5", "SMA ATR MT5", "EMA+RSI MT5", "Defaults MT4", "SMA ATR MT4", "EMA+RSI MT4"]
    y-axis "arrows compared" 0 --> 18000
    bar [9014, 16893, 4916, 6667, 12260, 3598]
(MT4 "Defaults" is 6,514 arrows over 12 runs plus 153 in the every-tick run = 6,667.)
2. Repaint probe. An EA records which signal buffers are set on each bar at the moment it closes, then reads the same bars again at the end and counts any value that changed. It also counts any signal ever shown on the still-forming bar.
| Run | Closed bars checked | Signals seen at close | Changed afterwards | Signals on the live bar |
|---|---|---|---|---|
| MT5, EURUSD H1, every tick, 10,411,052 ticks | 4,644 | 126 | 0 | 0 |
| MT4, 37 runs combined | 756,852 | 22,449 | 0 | 0 |
Source: tests/results/repaint-summary.md. The MT5 repaint probe was run once (EURUSD H1,
default inputs); the MT4 probe ran on every dump run.
3. Market validation. Both Market builds passed the MQL5 Market's automated product validation before publication (this is the Market's own check, not part of this repository).
flowchart LR
    R[reference.py<br/>Python, from the TradingView behaviour] --> P
    S5[MT5 indicator] --> T5[Tester script<br/>DumpIndicator<br/>every bar to CSV]
    S4[MT4 indicator] --> T4[Tester EA<br/>SuperTrendDump + Dump4.mqh<br/>CSV + repaint log]
    T5 --> P[check_parity.py<br/>line 1e-9, same arrows]
    T4 --> P
    S5 --> RP[RepaintProbe EA<br/>values at close vs final]
    T4 --> RL[repaint log<br/>per run]
    P --> V{all pass?}
    RP --> V
    RL --> V
    V -- yes --> M[Market validation]
    V -- no --> F[fix, rerun everything]
Why the design cannot repaint
- Arrows are written only when
i <= rates_total - 2, i.e. never on the forming bar. - Each bar's bands and trend depend only on that bar and earlier bars (recursive formulas, no look-ahead).
- Alerts fire only for the bar that just closed, only after the history load, once per bar, and never in the tester.
- What does move: the line on the forming bar, because the live bar's high, low and close change. That is not a signal.
Architecture and buffers
flowchart TB
    subgraph MT5["mql5/Indicators/SuperTrendSignalAlerts"]
        A5[SuperTrendSignalAlerts.mq5<br/>inputs, buffers, OnCalculate]
        B5[SignalAlerts.mqh<br/>alert inputs, TfName, SignalAlert]
        A5 -- include --> B5
    end
    subgraph MT4["mql4/Indicators/SuperTrendSignalAlerts"]
        A4[SuperTrendSignalAlerts.mq4]
        B4[SignalAlerts.mqh<br/>MT4 edition]
        A4 -- include --> B4
    end
    subgraph TESTS[tests]
        R[reference.py]
        C[check_parity.py]
        D5[mql5: DumpIndicator, RepaintProbe, Params.mqh]
        D4[mql4: SuperTrendDump.mq4, Dump4.mqh]
        C --> R
    end
    D5 -. iCustom/IndicatorCreate .-> A5
    D4 -. iCustom .-> A4
classDiagram
    class SuperTrendSignalAlerts {
        +InpATR int
        +InpMult double
        +InpMethod ENUM_ST_ATR
        +InpUseEMA bool
        +InpEMA int
        +InpUseRSI bool
        +InpRSI int
        +OnInit()
        +OnCalculate()
    }
    class SignalAlerts {
        +InpAlertPopup bool
        +InpAlertSound bool
        +InpAlertPush bool
        +InpAlertEmail bool
        +g_alert_last datetime
        +TfName()
        +SignalAlert()
    }
    class reference {
        +true_range()
        +sma()
        +rma()
        +ema()
        +rsi()
        +supertrend()
    }
    SuperTrendSignalAlerts --> SignalAlerts : alerts
    reference ..> SuperTrendSignalAlerts : same maths, compared by check_parity
iCustom buffer table (for EA developers)
| Buffer | MT5 | MT4 |
|---|---|---|
| 0 | SuperTrend line (colour line) | SuperTrend line (not drawn; read this one) |
| 1 | colour index of the line (0 blue, 1 red) | blue half of the drawn line |
| 2 | Buy arrow price (bar low), empty otherwise | Buy arrow price, empty otherwise |
| 3 | Sell arrow price (bar high), empty otherwise | Sell arrow price, empty otherwise |
| 4 | trend EMA (when the filter is on) | red half of the drawn line |
| 5 | calculation buffer | trend EMA (when the filter is on) |
| 6-12 (MT5) / 6-13 (MT4) | calculation buffers (bands, trend, ATR, EMA, RSI, gains, losses) | calculation buffers |
Empty value is EMPTY_VALUE. Read arrows on closed bars (shift 1 and higher). iCustom parameters follow the input
order: ATR period, ATR multiplier, ATR method, EMA filter, EMA period, show EMA, RSI filter, RSI period, show line, arrow
gap, pop-up, sound, sound file, push, e-mail, debug. In MT5 the input group headings also count as string parameters when you
build a handle with IndicatorCreate (see tests/mql5/Include/IndTest/Params.mqh).
Inputs, alerts, install and compile
| Input | Default | Meaning |
|---|---|---|
| ATR period | 10 | Length of the ATR |
| ATR multiplier | 3.0 | Band distance in ATRs. Lower: flips sooner and more often. Higher: later |
| ATR method | RMA / Wilder | RMA (same as ta.atr) or SMA of the true range |
| Only signals with the EMA trend | false | Buy only above the EMA, sell only below |
| EMA period | 200 | Length of the trend EMA |
| Draw the EMA | true | Show the EMA when the filter is on |
| Buy only RSI above 50, sell only below | false | RSI filter on arrows and alerts |
| RSI period | 14 | Length of the RSI |
| Draw the SuperTrend line | true | Show or hide the line (arrows stay) |
| Arrow distance from the candle | 12 px (MT5) / 0.3 x ATR (MT4) | Gap between arrow and candle |
| Pop-up alert | true | Terminal alert window |
| Play a sound / sound file | false / alert.wav | File from the terminal's Sounds folder |
| Push notification | false | Needs your MetaQuotes ID in Options |
| false | Needs e-mail set up in Options | |
| Debug log for bug reports | false | Writes extra lines to the Experts tab, to attach when you report a problem |
Alert text: SuperTrend EURUSD H1: BUY, trend up from 1.08512.
Install from source. Copy mql5/Indicators/SuperTrendSignalAlerts/ into <terminal data folder>/MQL5/Indicators/ (MT5) or
mql4/Indicators/SuperTrendSignalAlerts/ into <data folder>/MQL4/Indicators/ (MT4), open SuperTrendSignalAlerts.mq5 or
.mq4 in MetaEditor and press Compile (F7). Both compile with 0 errors (checked on a Windows machine with MetaEditor; the
compiled files are not in the repository). Keep the two files of each edition together: the indicator includes
SignalAlerts.mqh from its own folder. The debug log needs the Chart Kit file as well: copy mql5/Include/ChartKit/ (MT5) or mql4/Include/ChartKit/ (MT4) into the Include folder of the data folder.
Run the Python reference and the tests
python3 -m venv .venv && . .venv/bin/activate && pip install -r requirements.txt
import sys; sys.path.insert(0, "tests")
import numpy as np
from reference import supertrend
# o, h, l, c are float arrays of OHLC bars, oldest first
line, buy, sell = supertrend(o, h, l, c, period=10, mult=3.0)   # buy/sell hold the arrow price or NaN
To repeat the parity check on your own data:
- Compile the indicator and the test tool for your platform (
tests/mql5/Scripts/DumpIndicator, ortests/mql4/SuperTrendDump.mq4withtests/mql4/Include/IndTest4/Dump4.mqhin yourMQL4/Include/IndTest4/; MT5 also needstests/mql5/Include/IndTest/Params.mqh). - Run it in the Strategy Tester (MT4) or as a script (MT5) for each symbol and timeframe, with the input sets in
tests/configs.tsv(MT5) /tests/mql4/configs.tsv(MT4). The tool writes one CSV per symbol and timeframe. python3 tests/check_parity.py <folder with the CSVs>. It prints PASS or FAIL per file and an overall result (the file names must start with the tagsst_default,st_sma_m2_p14,st_ema_rsi).- Repaint: run
tests/mql5/Experts/RepaintProbein the MT5 Strategy Tester (every tick); MT4 writes its repaint log with the dump.
The price dumps used for the published numbers are not in this repository (they are broker price data).
Honest limits
- An indicator signal is not a strategy. No stop-loss, position sizing or exit rules are provided or implied, and the arrows were not optimised or back-tested for profit. Whether a trend flip makes money depends on your market, costs and rules.
- No profit or accuracy claim is made. The only numbers here are about consistency (the three implementations agree, signals do not move) and frequency (arrows per month).
- Lag is built in. The line turns after the move has started; a higher multiplier turns later still.
- Sideways markets produce frequent flips; the EMA and RSI filters reduce some of them but not all.
- Data-dependent. ATR is seeded from the first bars in the terminal's history, so the very first arrows of a short history can differ from a longer one.
- Scope of the tests. Four symbols, three timeframes, three input sets, one MT5 repaint run. Other symbols and timeframes are not covered by the published numbers. The MT5 build was not run on a live chart as part of these numbers.
Free, with no paid edition
SuperTrend Signal Alerts has no paid sibling: the Market builds and this source are the same free indicator, with every input described above. Website: allanninal.dev/mql5 (MT4).
Licence and credits
Origin of the maths. SuperTrend is a trend-following indicator created by Olivier Seban. The TradingView "SuperTrend" script, which many traders know it by, is by KivancOzbilgic; it is open source on TradingView. Thank you to both.
What this means for the licence. TradingView publishes open-source scripts under the Mozilla Public License 2.0 unless the author states another licence. I did not confirm what licence the original script's header states, so I took the conservative route: the three files that implement the SuperTrend calculation are licensed MPL-2.0:
mql5/Indicators/SuperTrendSignalAlerts/SuperTrendSignalAlerts.mq5mql4/Indicators/SuperTrendSignalAlerts/SuperTrendSignalAlerts.mq4tests/reference.py
They are independent implementations in other languages (the Python one written from the script's described behaviour, not translated), plus additions (closed-bar signals, alerts, EMA and RSI filters), but treating them as derived from an MPL-2.0 work is the safe reading. MPL-2.0 is file-level: changes to those files must stay MPL-2.0 and be shared.
Everything else (alert helper SignalAlerts.mqh, test tools, parity checker, docs, images) is © 2026 Allan Niñal under the
PolyForm Noncommercial License 1.0.0: free for personal and other
noncommercial use, not for commercial use (source-available, not OSI open source). Each source file has an
SPDX-License-Identifier line. Texts: LICENSE, LICENSES/MPL-2.0.txt. The licence
applies to this source, not to anything you build or trade with the indicator. Trading involves risk; the software is
provided as is.
Website: allanninal.dev/mql5 · MT4 · allanninal.dev · Questions: message me on LinkedIn.