- MQL5 78.4%
- MQL4 12.6%
- Python 9%
| Filename | Latest commit message | Latest commit date |
|---|---|---|
|
|
||
| docs | ||
| LICENSES | ||
| mql4 | ||
| mql5 | ||
| research/results | ||
| tests | ||
| .gitignore | ||
| LICENSE | ||
| README.md | ||
| requirements.txt | ||

Displacement Order Blocks (MetaTrader 5 and MetaTrader 4)
A free indicator that draws demand and supply zones left by a strong candle that closes through the newest swing, and follows each zone through three states: fresh, tested and broken. Everything is decided on closed bars, so a zone never appears, moves or disappears after its bar has closed. Source for both editions, a Python reference of the rules, and the tests that were used to check that the MT5 and MT4 code, the Python reference and each other all agree.
Website: allanninal.dev/mql5 (indicators) · MT4 editions · allanninal.dev · Contact: message me on LinkedIn.
It is an indicator, not a strategy. It draws zones and sends alerts, and places no trades. The zones describe what price did on past bars; they are not predictive. A test against randomly placed levels, with the numbers, is in Do the zones predict anything?.
Get it on the MQL5 Market
| Edition | Platform | Price | Link |
|---|---|---|---|
| Displacement Order Blocks | MT5 | free | coming soon on the MQL5 Market |
| Displacement Order Blocks MT4 | MT4 | free | coming soon on the MQL5 Market |
The Market builds will be the same calculation as the source in this repository.
Contents
- What it is and who it is for
- Why it was built
- How it works
- Do the zones predict anything? No, measurably
- Non-repainting and the tests
- Architecture and buffers
- Inputs, alerts, install and compile
- Run the Python reference and the tests
- Honest limits
- Licence
What it is and who it is for
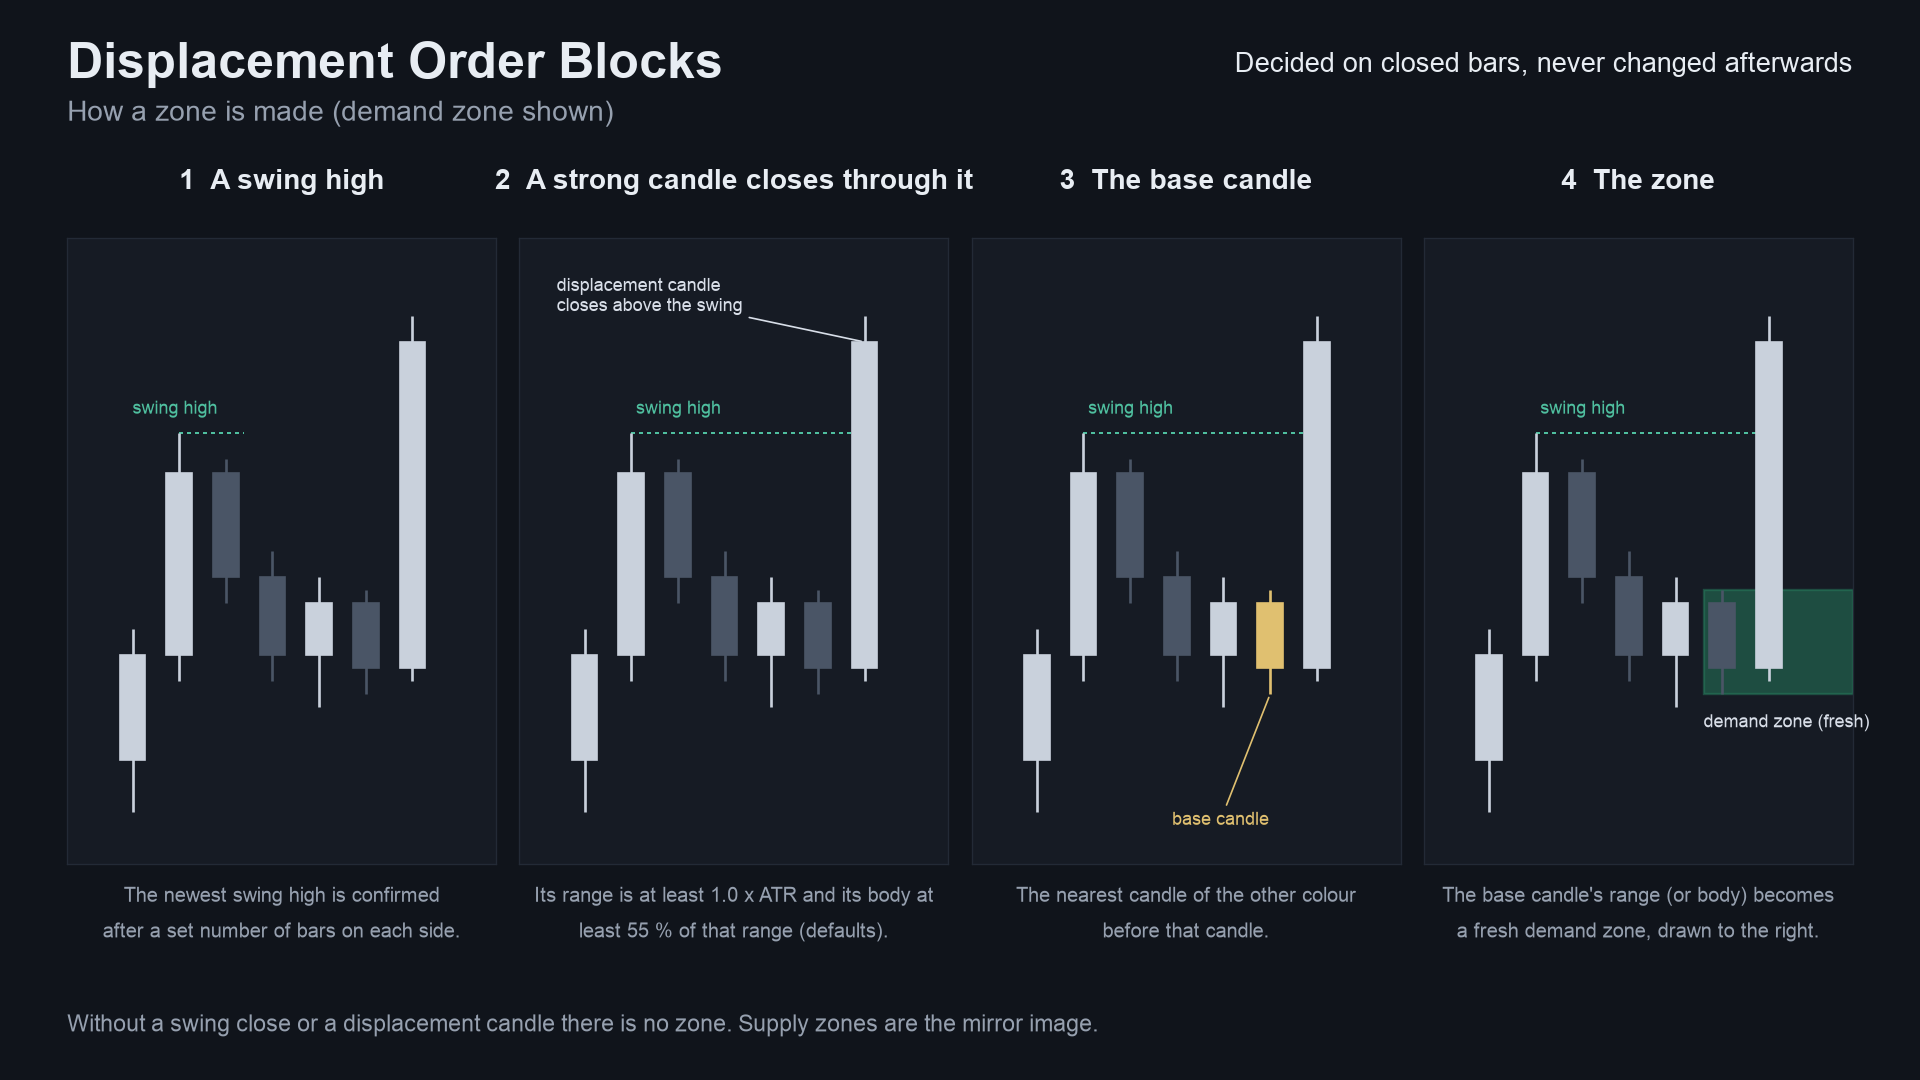
What: a zone is made when a candle (the displacement candle) closes beyond the newest swing high or low, with a range
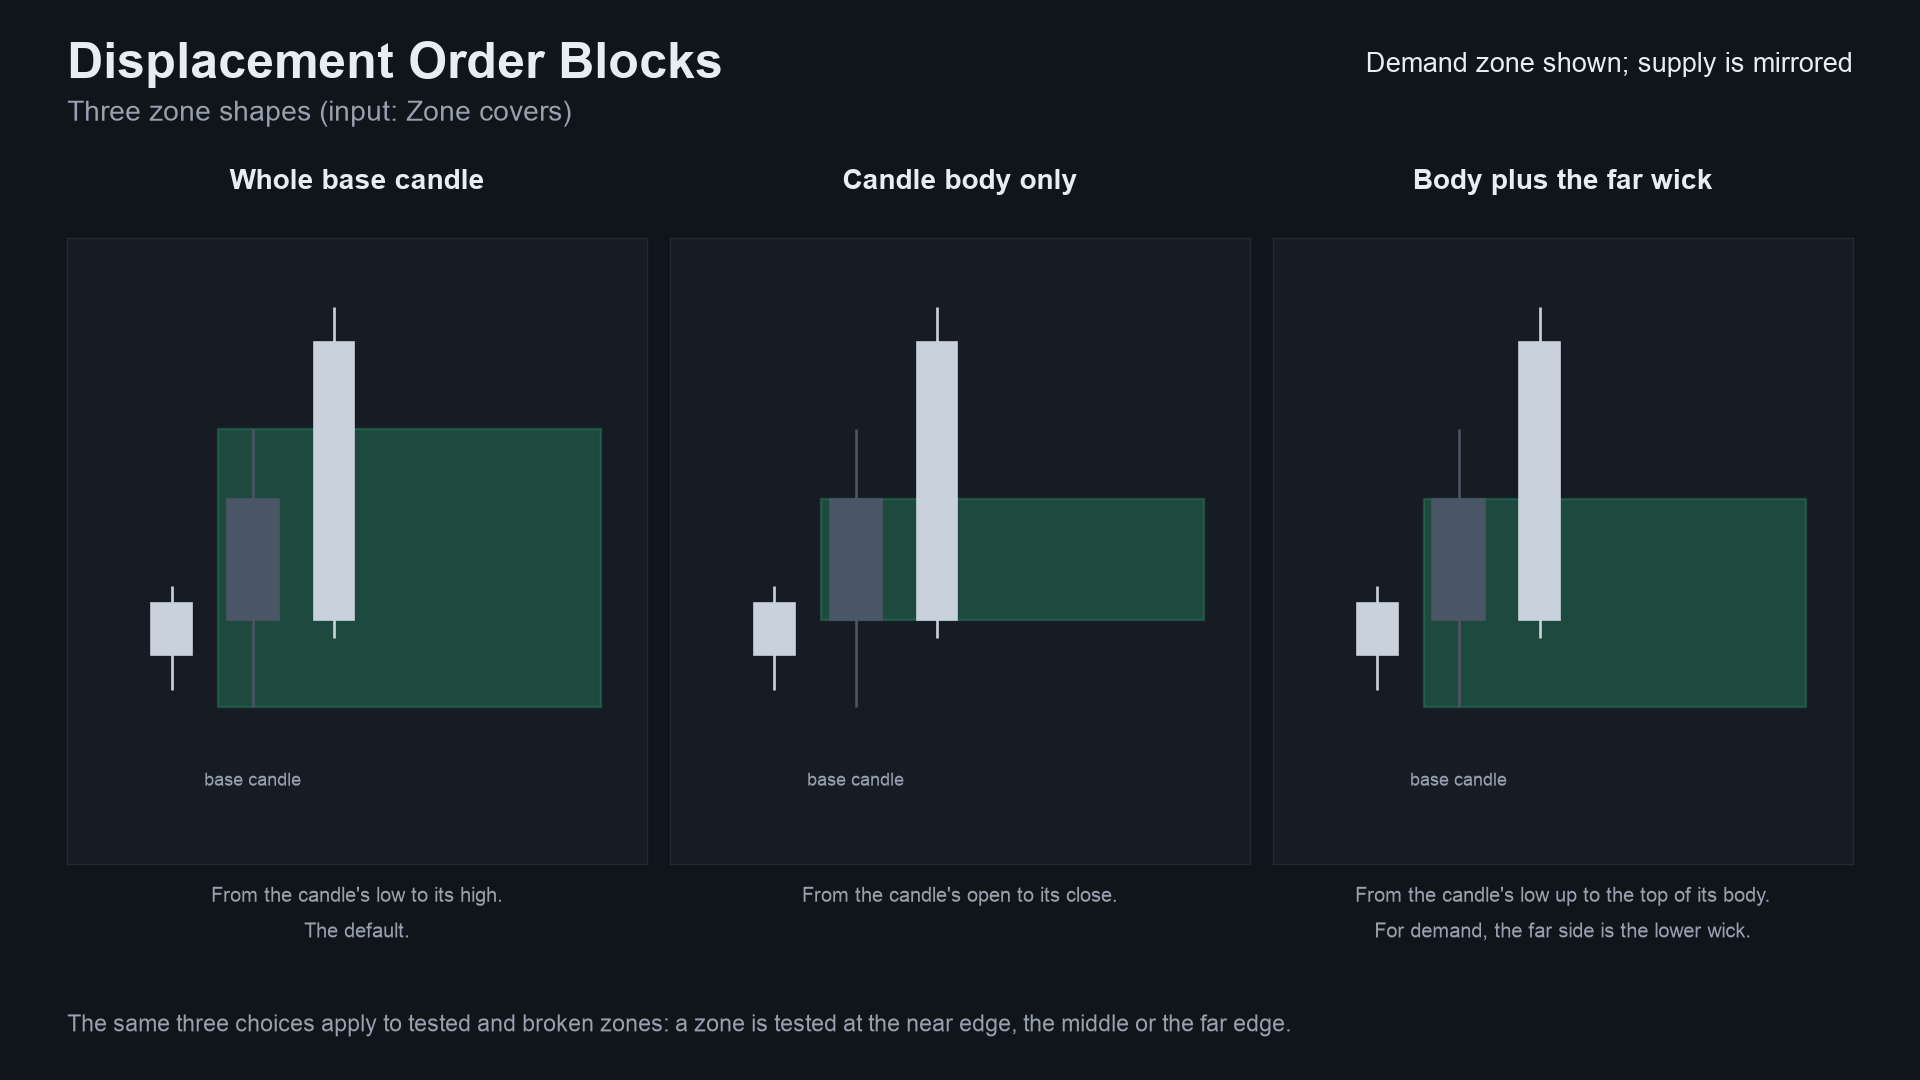
of at least 1.0 x ATR and a body of at least 55 % of its range. The zone is the nearest candle of the other colour
before it (its whole range, its body, or its body plus the far wick). The zone is drawn to the right until price breaks
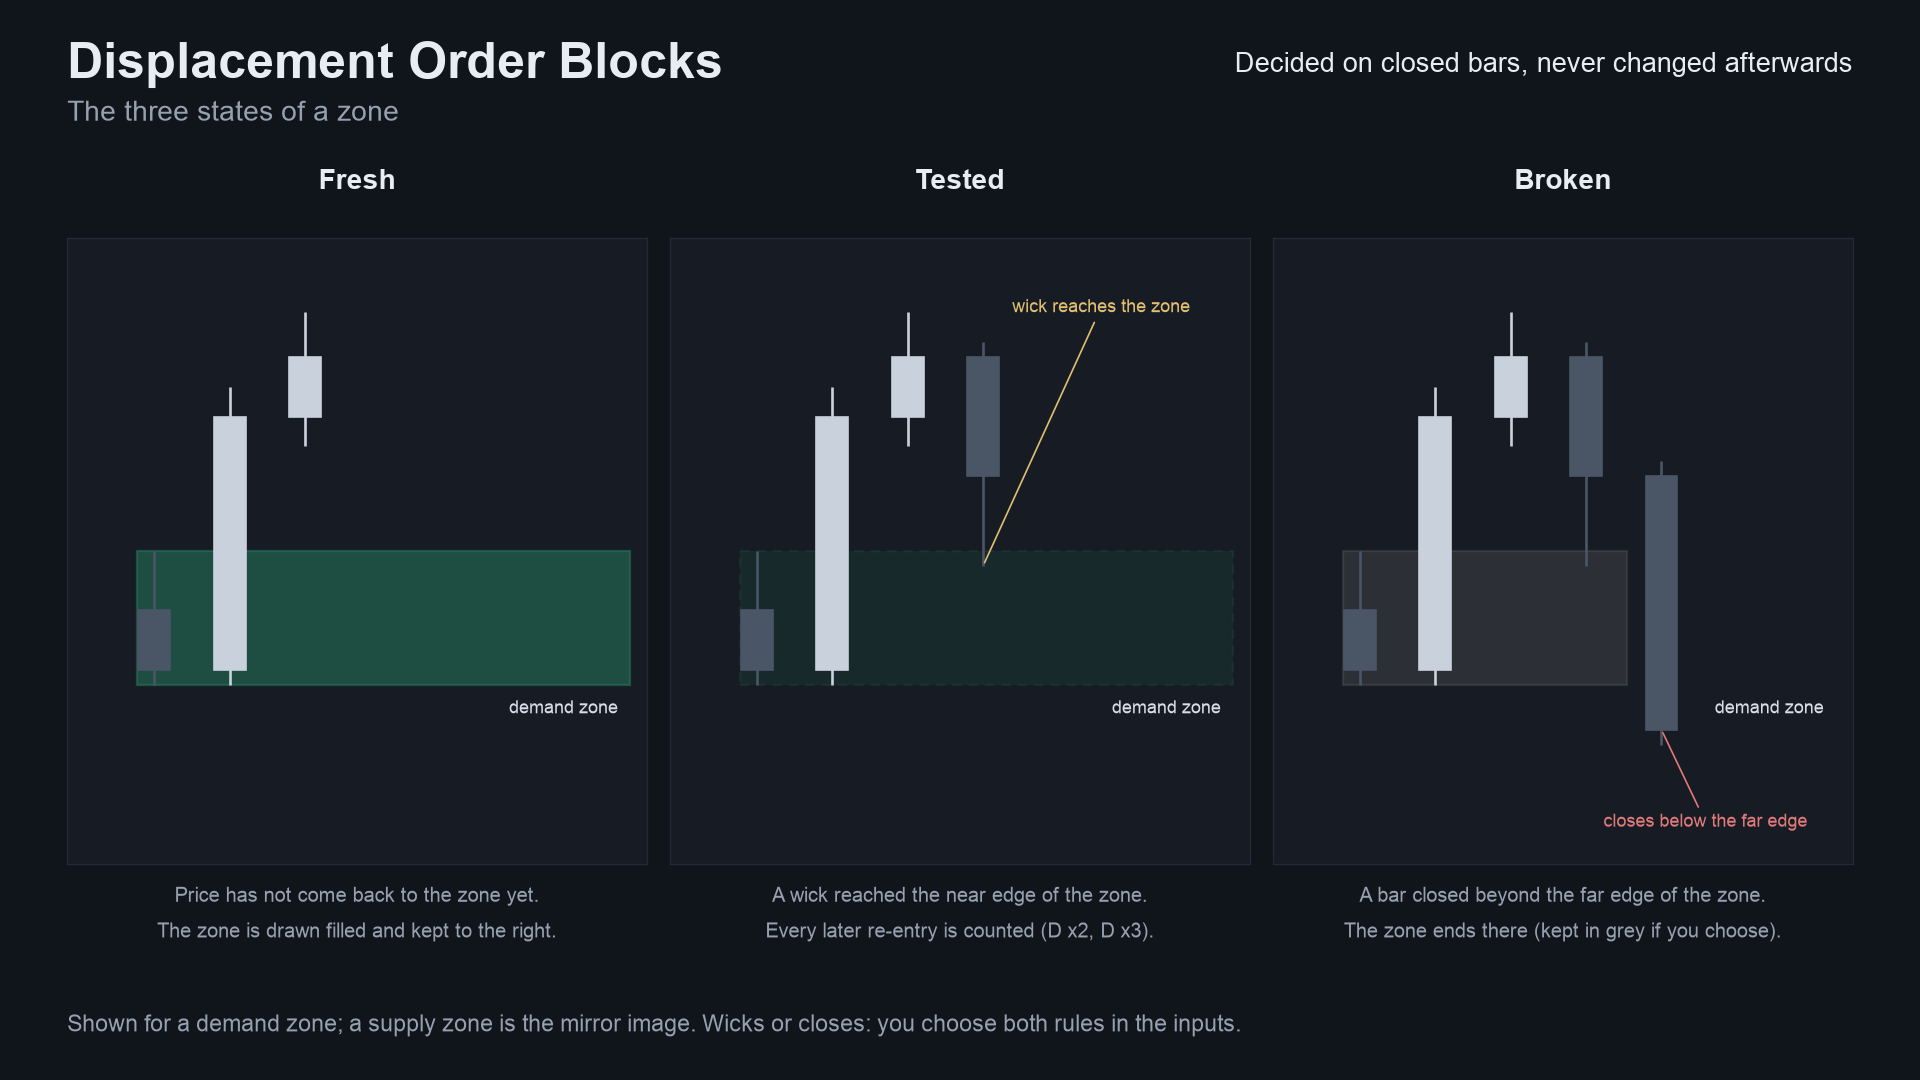
it. It is fresh until a wick comes back to it, tested after that (every later re-entry is counted, shown as D x2,
S x3) and broken once a bar closes (or wicks, your choice) beyond its far edge. Alerts for a new zone, a first test
and a broken zone, by pop-up, sound, push notification and e-mail.
For: traders who mark order blocks or supply and demand zones by hand and want the same objects drawn by fixed,
written-out rules, so that the chart can be reproduced and checked. Also for developers who want a small, tested zone
engine with documented buffers to read from an EA with iCustom.
Not for: anyone who expects a zone to predict a reaction. See the measured result below.
 |
 |
 |
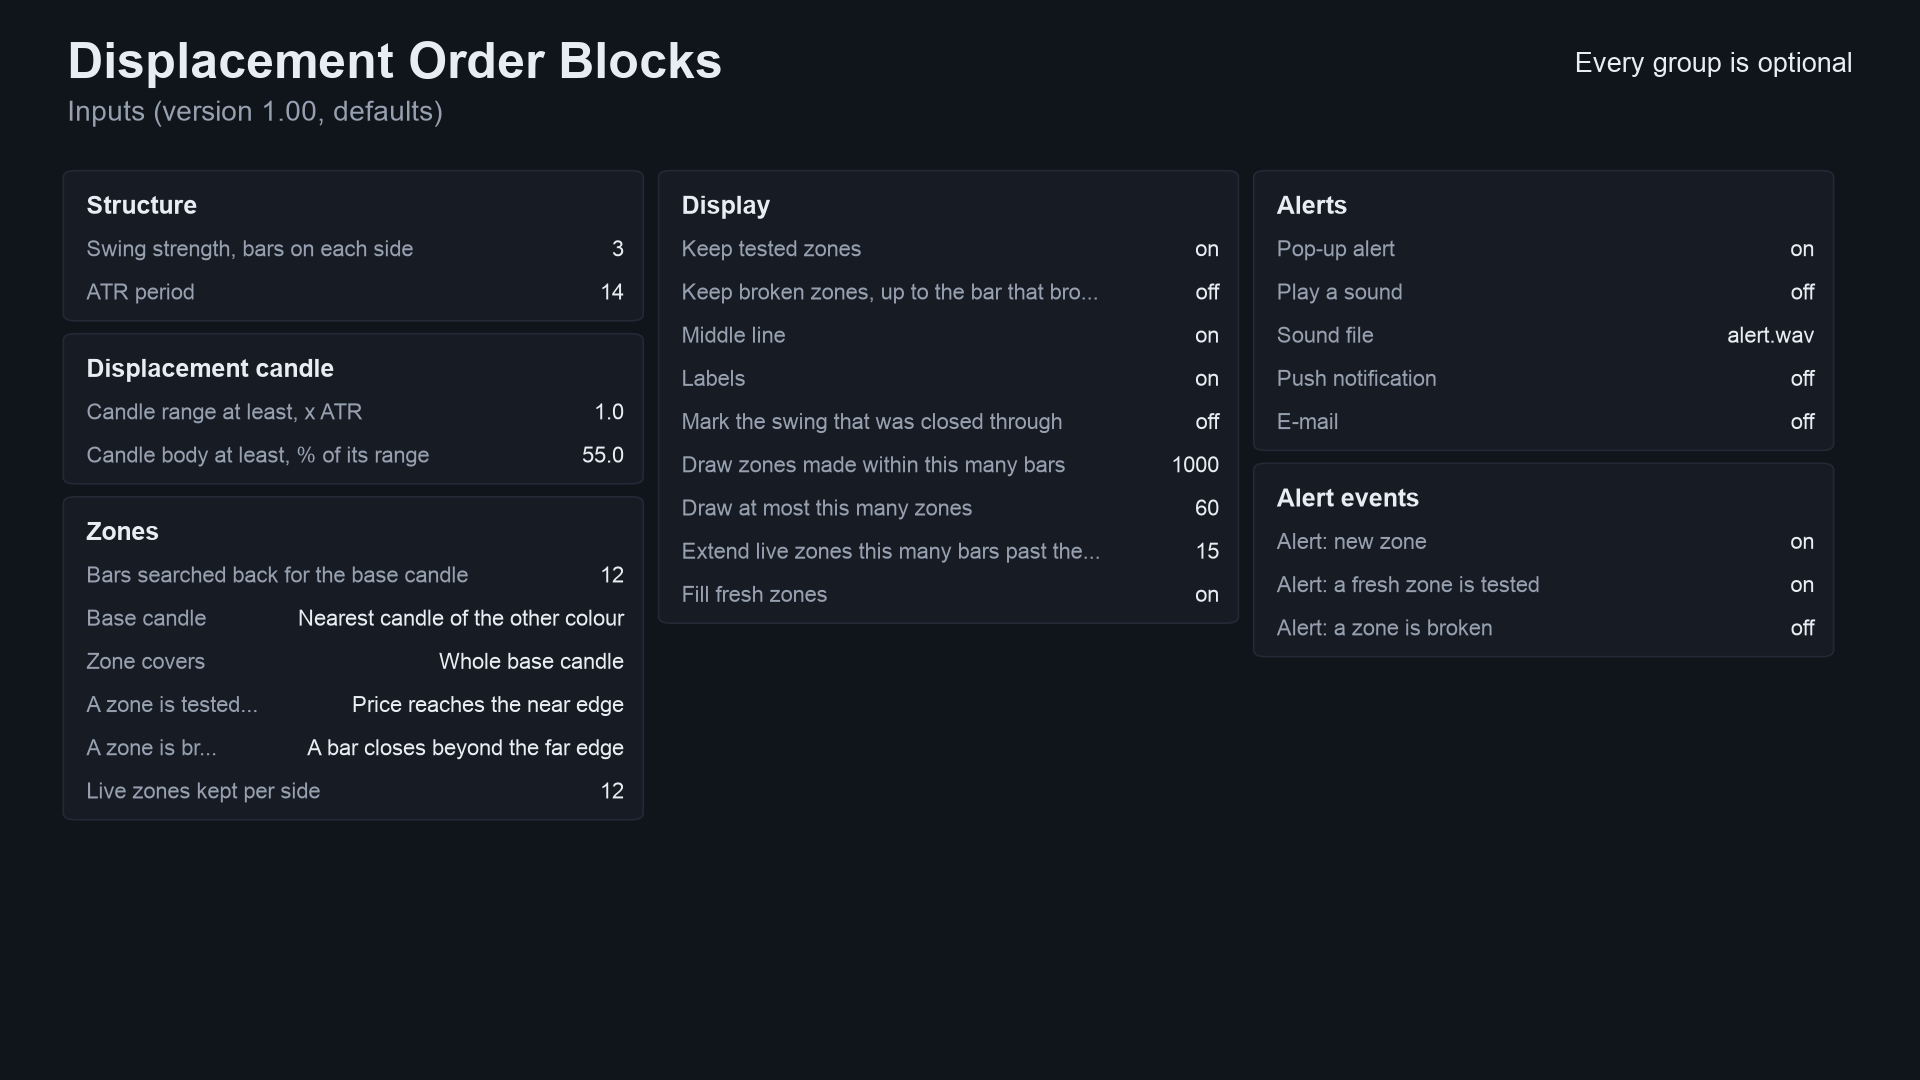 |
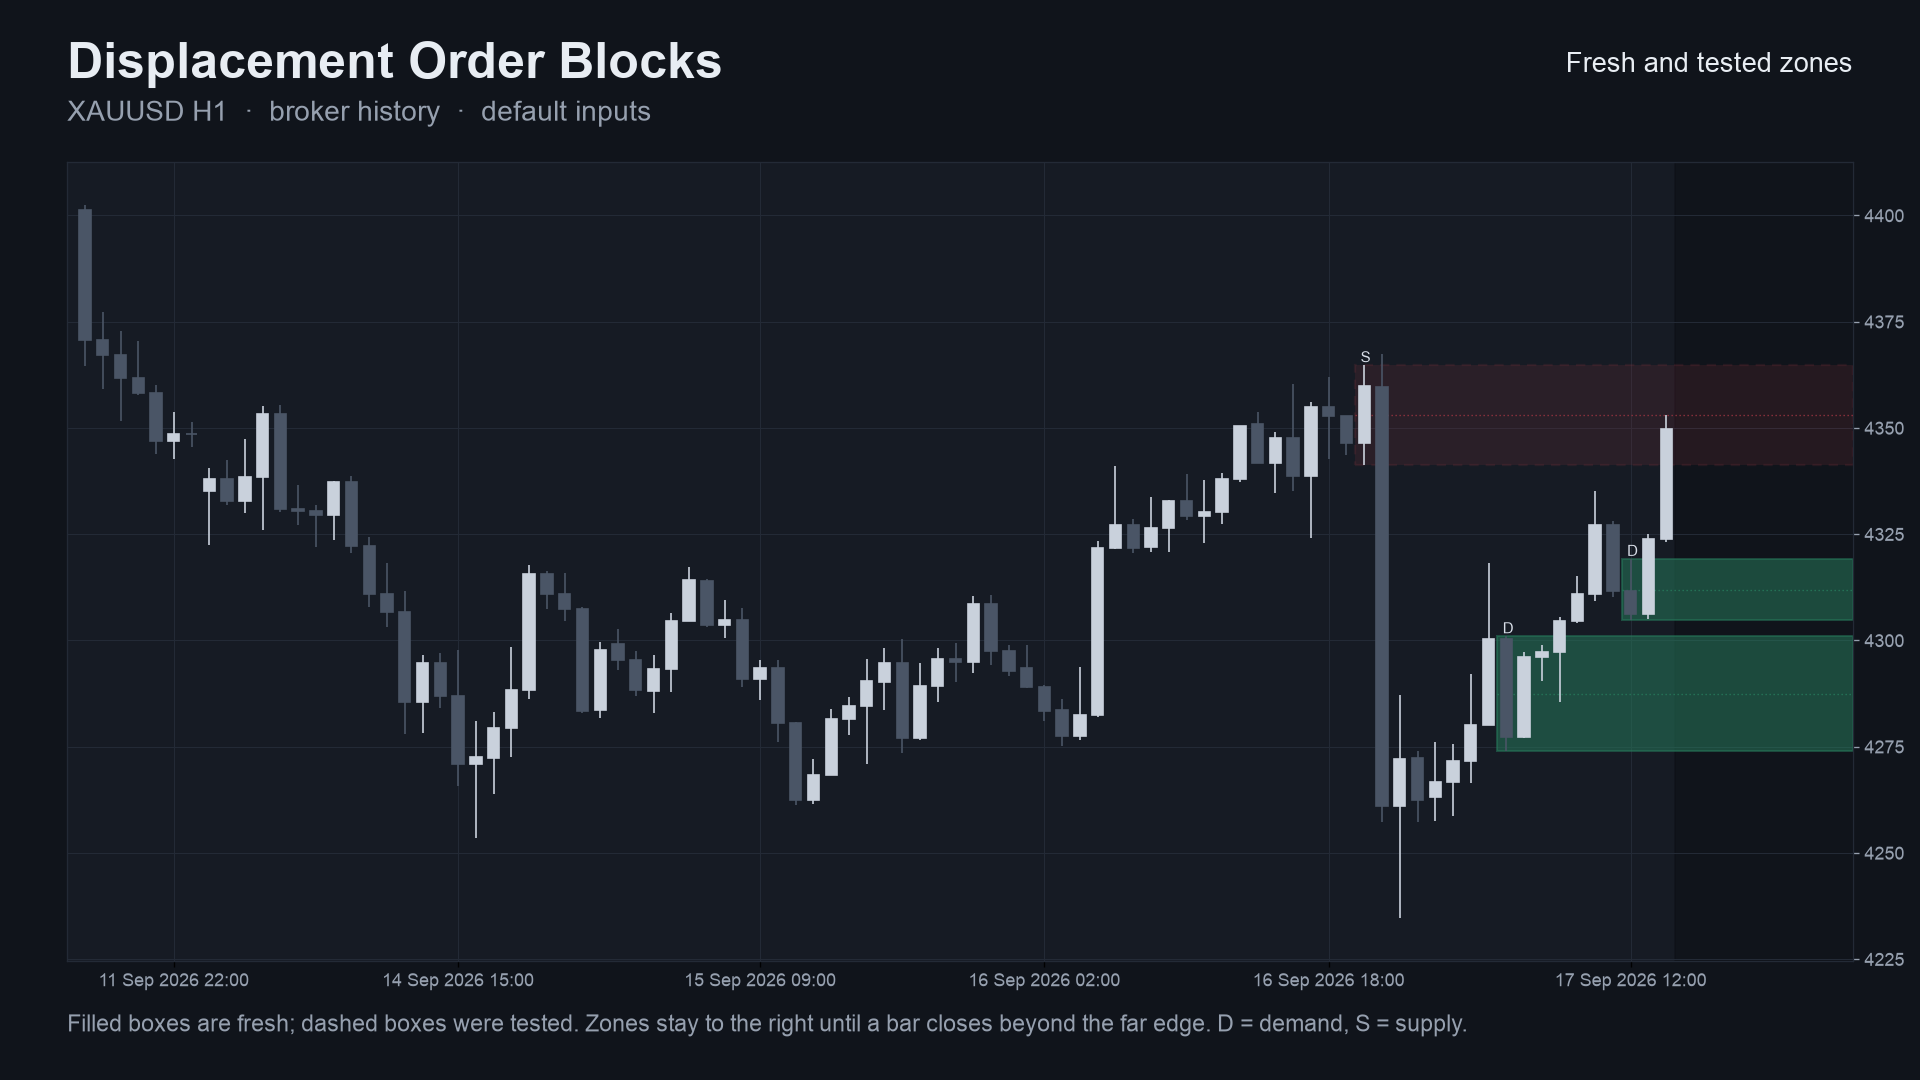
Image notes: the chart on 01 and 02 is drawn by the Python reference on broker history (the same zones the indicator
draws); the other images are schematic cards. They are illustrations, not terminal captures. MT4 versions are in
docs/images/mt4/.
Why it was built
Order blocks are everywhere in retail trading content, and traders ask for tools that mark them. The reasons for building this one, with the evidence we actually have:
- A readable, written-out rule set. "Order block" means different things in different tools. Here every step of the detection is a formula you can read and test (below).
- Demand exists, but it is crowded. A scan of 2,014 MQL5 Freelance jobs (2025-11 to 2026-10, keyword classification, accurate to roughly plus or minus 15 %) found 116 jobs in the SMC / ICT / order block / FVG / liquidity group and 26 that mention an order block. The MQL5 Market already has many order-block and market-structure indicators, so this is not a gap in the market. It is one more careful implementation with tests.
- Trust in what is drawn. In the same freelance scan, 29 jobs list "non-repainting" as an explicit requirement, so the design rule is that nothing on the chart changes after its bar has closed.
- Honesty about value. We tested whether these zones react better than levels placed at random (below). They do not, by a margin that is not meaningful. So this is a drawing and bookkeeping tool, and it says so.
mindmap
  root((Displacement Order Blocks))
    Problem
      Order block means different things in different tools
      Zones that repaint or vanish
      Hard to check what a tool really does
    Design rules
      Zone only after a strong close through a swing
      Closed bars only, nothing changes later
      Same maths on MT5 MT4 and Python
    Proof
      Python reference
      Bar by bar parity
      Tester repaint probe
      Random-placement test, no edge found
How it works
The rules, step by step
Let O, H, L, C be a bar's open, high, low, close, i the bar index (oldest = 0), d = +1 for demand (bullish) and
d = -1 for supply (bearish). Defaults in brackets.
-
ATR (Wilder's smoothing, seeded with the simple average of the first
ntrue ranges,n= 14):TR[i] = max(H-L, |H-C[i-1]|, |L-C[i-1]|),ATR[i] = (ATR[i-1] * (n-1) + TR[i]) / n. The test on bariuses the ATR as it was before the bar,ATR[i-1]. -
Swing (
swing= 3): barpis a swing high when theswingbars on its left have strictly lower highs and theswingbars on its right have highs not above it (mirror image for a low). It is knownswingbars later. A new swing replaces the previous swing of its side. -
Break: the first bar whose close is beyond the newest swing high (demand) or low (supply). That swing is then used up, whether or not a zone is made.
-
Displacement candle: the breaking bar must have
H-L >= 1.0 x ATR[i-1], a body|C-O| >= 55 %of its range, and close in the break's direction ((C-O) * d > 0). A body of exactly 55 % counts: decimal prices can leave the last bit off, so a tolerance of1e-9 x rangeis applied identically in MQL5, MQL4 and Python. -
Base candle among the
searchbars before the break bar (search= 12):- mode "Nearest candle of the other colour" (default): the nearest bar going back with
(C-O) * d < 0; - mode "Other-colour candle where the move began": find where the move started inside those bars (demand: the lowest low, supply: the highest high, the latest bar on a tie), then take the nearest other-colour candle at or before it, still inside the window.
No such candle means no zone.
- mode "Nearest candle of the other colour" (default): the nearest bar going back with
-
Zone:
topandbotof the base candle, as the whole candle (high to low), the body only, or the body plus the far-side wick (demand: low to body top, supply: body bottom to high). The zone exists from the bar after the break. -
States, checked on each later closed bar, broken first (a bar that does both only breaks the zone):
- tested: a wick reaches the near edge (default), the middle, or the far edge, from the bar after the zone was made;
- retest: after a bar that was outside, a later wick enters again; each re-entry is counted;
- broken: a close (default) or a wick beyond the far edge.
-
Limit (
max live= 12): at most 12 live zones per side. When a new one is made, the oldest live zone of that side is dropped.
Per-bar algorithm
flowchart TD
    A[Closed bar i] --> B[Update ATR, keep ATR before this bar]
    B --> C[For each live zone: broken? tested? re-entered?]
    C --> D{Close beyond the newest swing?}
    D -- no --> K
    D -- yes --> E[Use that swing up]
    E --> F{Range, body and colour pass?}
    F -- no --> K
    F -- yes --> G[Find the base candle inside the search window]
    G --> H{Base candle found?}
    H -- no --> K
    H -- yes --> I[Zone top and bottom from the chosen shape]
    I --> J[Add the zone, drop the oldest of that side if over the limit]
    J --> K[Is bar i - swing a swing high or low? Remember it]
    K --> L[Write the 13 buffer values for bar i]
Zone states
stateDiagram-v2
    [*] --> Fresh: displacement close made the zone
    Fresh --> Tested: a wick reaches the test level
    Tested --> Tested: re-entry after a bar outside (counted)
    Fresh --> Broken: a close or wick beyond the far edge
    Tested --> Broken: a close or wick beyond the far edge
    Fresh --> Dropped: oldest of its side when over the limit
    Tested --> Dropped: oldest of its side when over the limit
    Broken --> [*]
    Dropped --> [*]
Alert flow
sequenceDiagram
    participant T as Terminal
    participant I as Indicator
    participant H as Alert helper
    participant U as You
    T->>I: OnCalculate (history load, prev_calculated = 0)
    I->>I: run the engine over all closed bars
    I->>H: events on the last closed bar? live = false
    H-->>I: ignored (never alert during history load)
    T->>I: OnCalculate (a bar closes, prev_calculated > 0)
    I->>I: step the engine over the bar that just closed
    I->>H: SignalAlert(text, bar time, live = true)
    alt bar time is newer than the last alert and not in the tester
        H->>U: pop-up (optional sound, push, e-mail)
    else same bar again or tester run
        H-->>I: nothing sent
    end
How often it makes zones (measured)
Zones made per month by the Python reference with the default inputs on closed bars of broker history, 2023-10-02 to
2026-10-12 (36 months). Source: docs/data/zones-per-month.json. This counts zones only.
It says nothing about profit.
xychart-beta
    title "Zones made per month by timeframe (EURUSD and XAUUSD, defaults)"
    x-axis ["M15", "H1", "H4", "D1"]
    y-axis "zones per month" 0 --> 90
    bar [81.8, 21.3, 6.6, 1.0]
    bar [77.7, 20.1, 6.2, 1.0]
First series EURUSD, second XAUUSD.
Do the zones predict anything? No, measurably
Before publishing, the zones were tested against levels placed at random. The question: after price first comes back to a zone, does it move away from the zone more often than it would from a level of the same size and distance that is not a zone? The result is that the difference from random placement is not meaningful. These tables are part of the README on purpose: do not read the zones as support and resistance that is likely to hold.
Method (descriptive study, not a trading test).
- Data: broker M1 history resampled to H1 and H4, 2015-01 to 2026-10, eight symbols (EURUSD, GBPUSD, USDJPY, AUDUSD, GBPJPY, XAUUSD, XAGUSD, BTCUSD), so 16 symbol and timeframe cells. Bid bars; no spread, no costs.
- Zones: the Python reference with the default inputs, except no zone limit so every zone is followed (31,823 zones with the default base candle, 26,192 with the "where the move began" base candle).
- Outcome: after the first test, price either moves
1.0 x ATR(the ATR before the displacement candle) away from the zone in its direction before a bar closes through the far edge ("held"), or the close comes first ("failed"). Neither within 50 bars counts as open. Held rate = held / (held + failed). - Control: each real zone is copied with the same creation bar, direction, height and ATR, but its near edge is moved to the distance from the creation bar's close of another real zone of the same direction, picked by a random shuffle. The same state rules run on it. 500 shuffles give the held rate that a level of that size and distance would get anyway.
- Split: zones made 2015-2020 (train) and 2021-2026 (holdout). Nothing is fitted; the split only shows whether an effect repeats.
- Check: the simulator's outcome for every real zone was asserted equal to the engine's.
Result. Source: research/results/zone_stats.csv (default base) and
research/results/zone_stats_move.csv (move-began base), 16 cells each.
| Base candle | Period | Cells where real > random | Mean held-rate difference | Cells with p < 0.05 (chance: about 0.8 of 16) |
|---|---|---|---|---|
| Nearest other colour (default) | train 2015-2020 | 10 / 16 | +0.8 points | 2 / 16 |
| Nearest other colour (default) | holdout 2021-2026 | 9 / 16 | +0.2 points | 1 / 16 |
| Where the move began | train 2015-2020 | 11 / 16 | +1.1 points | 4 / 16 |
| Where the move began | holdout 2021-2026 | 13 / 16 | +1.2 points | 4 / 16 |
With the default base candle the real zones "hold" about 57 % of the time and the random levels about 56 %. Nearly all of that rate is geometry (a level of ATR size just below price), not the zone, and the small 2015-2020 effect did not repeat in 2021-2026. The "where the move began" mode shows a difference of about one percentage point that appeared in both halves, which is the one result worth a second look. About one point on a hold rate, measured on bid bars before spread, across 16 cells and two modes tried, is not an edge.
Held rate minus random-placement rate, in percentage points, over all years, per cell (default base candle). Cell numbers: 1 EURUSD H1, 2 EURUSD H4, 3 GBPUSD H1, 4 GBPUSD H4, 5 USDJPY H1, 6 USDJPY H4, 7 AUDUSD H1, 8 AUDUSD H4, 9 GBPJPY H1, 10 GBPJPY H4, 11 XAUUSD H1, 12 XAUUSD H4, 13 XAGUSD H1, 14 XAGUSD H4, 15 BTCUSD H1, 16 BTCUSD H4.
xychart-beta
    title "Held rate minus random placement, points (default base candle)"
    x-axis ["1", "2", "3", "4", "5", "6", "7", "8", "9", "10", "11", "12", "13", "14", "15", "16"]
    y-axis "points" -4 --> 4
    bar [1.16, -0.75, 0.25, 0.65, 2.06, 0.76, -0.36, 1.33, 0.71, 0.5, 1.63, 0.62, 1.2, 0.47, 1.45, -1.01]
xychart-beta
    title "Held rate minus random placement, points (move-began base candle)"
    x-axis ["1", "2", "3", "4", "5", "6", "7", "8", "9", "10", "11", "12", "13", "14", "15", "16"]
    y-axis "points" -4 --> 4
    bar [1.04, -0.62, 1.21, 1.65, 2.41, 1.88, 0.34, -1.68, 0.56, 1.88, 2.16, -0.33, 2.93, 3.42, 3.13, 0.54]
The analysis script is not part of this repository; its per-cell output is. The per-cell differences are small, and they are in both directions.
Non-repainting and the tests
"Non-repainting" is easy to claim. Here is what was actually run. Raw result files are in tests/results/.
1. Three implementations, compared bar by bar. The Python reference
(tests/reference.py) is an independent re-implementation of the rules above. The MT5 and MT4
indicators were dumped bar by bar (all 13 buffers) in the MetaTrader test environment, and
tests/check_parity.py compared each dump with the reference. Pass means: on every closed bar
every buffer is equal (prices within 1e-9 relative, counts exactly, empty where the reference has nothing).
| MT5 | MT4 | |
|---|---|---|
| dumps compared | 48 (4 input sets x 4 symbols x M15/H1/H4) | 49 (same 48 + one every-tick EURUSD H1) |
| bars compared | 2,022,888 | 1,022,441 |
| zones compared | 71,611 | 33,030 |
| breaks of a swing compared | 145,245 | 73,420 |
| result | ALL PASS, 0 differences | ALL PASS, 0 differences |
Symbols: EURUSD, GBPJPY, XAUUSD, BTCUSD. Input sets: defaults; swing 5 / body zone / middle test / wick break / no limit;
swing 2 / ATR 10 / range 1.5 x ATR / body 60 % / search 5 / mixed zone / far-edge test / limit 3; the
"where the move began" base. Source: tests/results/parity-mt5-and-mt4.txt. The
MT5 M15 files are short (about 3,500 bars each); the MT4 M15 files are longer (up to about 44,000 bars).
xychart-beta
    title "Zones compared, Python vs MT5 indicator, per input set (all 0 differences)"
    x-axis ["Defaults", "Body/mid/wick", "Mixed/far", "Move-began base"]
    y-axis "zones compared" 0 --> 25000
    bar [21898, 15327, 16341, 18045]
2. Repaint probe. An EA records which zone-event buffers are set on each bar at the moment it closes, then reads the same bars again at the end and counts any value that changed. It also counts any event ever shown on the still-forming bar.
| Run | Closed bars checked | Zone events seen at close | Changed afterwards | Events on the live bar |
|---|---|---|---|---|
| MT5, EURUSD H1, every tick, 10,411,052 ticks | 4,644 | 531 | 0 | 0 |
| MT4, 49 runs combined | 1,005,828 | not summed | 0 | 0 |
Source: tests/results/repaint-summary.md. The MT5 repaint probe was run once (EURUSD H1,
default inputs); the MT4 probe ran on every dump run.
3. After the files were cut for this repository. The code in this repository is the free indicator without anything
the free indicator does not call. After the cut, both editions were compiled again with MetaEditor (0 errors, 0 warnings;
test tools too), the reduced Python reference was compared with the full one on 647,820 bars of broker history over 32 runs
(EURUSD, XAUUSD, GBPJPY, BTCUSD x H1/H4 x the four input sets): every buffer and every zone state identical, and a reduced
MT5 parity run was repeated on the files in this repository: 8 dumps (defaults and the "where the move began" base, EURUSD and
XAUUSD, H1 and H4, 502,472 bars), all 13 buffers equal on every closed bar
(tests/results/parity-after-cut.txt). The MT4 edition in this repository was
then run through the full MT4 matrix (EURUSD, GBPJPY, XAUUSD, BTCUSD x M15/H1/H4 x the four input sets, plus every tick
on EURUSD H1): 49 dumps, all identical to the reference on every closed bar, and the repaint probe found 0 closed bars
that changed afterwards. The large MT5 parity and repaint runs above were made on the build before the cut.
flowchart LR
    R[reference.py<br/>Python, written from the rules] --> P
    S5[MT5 indicator] --> T5[Tester script<br/>DumpIndicator<br/>every bar to CSV]
    S4[MT4 indicator] --> T4[Tester EA<br/>DisplacementOrderBlocksDump + Dump4.mqh<br/>CSV + repaint log]
    T5 --> P[check_parity.py<br/>13 buffers, same zones]
    T4 --> P
    S5 --> RP[RepaintProbe EA<br/>values at close vs final]
    T4 --> RL[repaint log<br/>per run]
    P --> V{all pass?}
    RP --> V
    RL --> V
    V -- yes --> M[Publish]
    V -- no --> F[fix, rerun everything]
Why the design cannot repaint
- The engine runs only over bars
0 .. rates_total - 2, never the forming bar. The last buffer value is always empty. - Each bar's result depends only on that bar and earlier bars. A zone that exists is never edited; it only changes state on later bars, and the drawing is rebuilt from the engine when a bar closes.
- A swing is known only
swingbars after it formed, and it is used only from then on (no look-ahead). - Alerts fire only for the bar that just closed, only after the history load, once per bar, and never in the tester.
- What does move: nothing on a closed bar. The right edge of live zones extends with the chart, which is a drawing detail, not a zone change.
Architecture and buffers
flowchart TB
    subgraph MT5["mql5/Indicators/DisplacementOrderBlocks"]
        A5[DisplacementOrderBlocks.mq5<br/>inputs, 13 buffers, OnCalculate]
        E5[DzEngine.mqh<br/>CDzEngine, zones, states]
        D5[DzDraw.mqh<br/>rectangles, midline, labels]
        B5[SignalAlerts.mqh<br/>alert inputs, SignalAlert]
        A5 -- include --> E5
        A5 -- include --> D5
        A5 -- include --> B5
        D5 -- include --> E5
    end
    subgraph MT4["mql4/Indicators/DisplacementOrderBlocks"]
        A4[DisplacementOrderBlocks.mq4]
        E4[DzEngine.mqh<br/>identical file]
        D4[DzDraw.mqh<br/>MT4 edition]
        B4[SignalAlerts.mqh<br/>MT4 edition]
        A4 -- include --> E4
        A4 -- include --> D4
        A4 -- include --> B4
    end
    subgraph TESTS[tests]
        R[reference.py]
        C[check_parity.py]
        D5T[mql5: DumpIndicator, RepaintProbe, Params.mqh]
        D4T[mql4: DisplacementOrderBlocksDump.mq4, Dump4.mqh]
        C --> R
    end
    D5T -. IndicatorCreate .-> A5
    D4T -. iCustom .-> A4
classDiagram
    class DisplacementOrderBlocks {
        +InpSwing int
        +InpATR int
        +InpDispMult double
        +InpBodyPct double
        +InpSearch int
        +InpBaseMode enum
        +InpZoneMode enum
        +InpTestMode enum
        +InpBreakMode enum
        +InpMaxLive int
        +OnInit()
        +OnCalculate()
    }
    class CDzEngine {
        +swing int
        +atr_period int
        +zones SDzZone[]
        +breaks SDzBreak[]
        +Defaults()
        +Reset()
        +Step(i, time, o, h, l, c, out)
    }
    class SDzZone {
        +dir int
        +top double
        +bot double
        +state int
        +retests int
    }
    class DzDraw {
        +DzDrawEngine()
        +SDzStyle
    }
    class SignalAlerts {
        +InpAlertPopup bool
        +g_alert_last datetime
        +SignalAlert()
    }
    class reference {
        +dz_zones()
    }
    DisplacementOrderBlocks --> CDzEngine : Step per closed bar
    DisplacementOrderBlocks --> DzDraw : redraw on a new bar
    DisplacementOrderBlocks --> SignalAlerts : alerts
    CDzEngine o-- SDzZone
    DzDraw ..> CDzEngine : reads zones
    reference ..> CDzEngine : same rules, compared by check_parity
iCustom buffer table (for EA developers)
All 13 buffers are the same in MT5 and MT4 and are not drawn (DRAW_NONE). A value is only set on the bar where the event
happened; otherwise EMPTY_VALUE.
| Buffer | Content |
|---|---|
| 0 / 1 | new demand zone: top / bottom |
| 2 / 3 | new supply zone: top / bottom |
| 4 | swing high that was closed through on this bar (price) |
| 5 | swing low that was closed through on this bar (price) |
| 6 | zones tested for the first time on this bar |
| 7 | retests of already tested zones on this bar |
| 8 | zones broken on this bar |
| 9 / 10 | live demand / supply zones after this bar |
| 11 / 12 | bars from the break bar back to the base candle of a new demand / supply zone |
Read events on closed bars (shift 1 and higher). iCustom parameters follow the input order below. In MT5 the
input group headings also count as string parameters when you build a handle with IndicatorCreate (see
tests/mql5/Include/IndTest/Params.mqh); MT4 has no groups.
Inputs, alerts, install and compile
| Input | Default | Meaning |
|---|---|---|
| Swing strength, bars on each side | 3 | Bars each side that must be lower (higher) for a swing |
| ATR period | 14 | Wilder ATR length |
| Candle range at least, x ATR | 1.0 | Displacement candle range |
| Candle body at least, % of its range | 55 | Displacement candle body share |
| Bars searched back for the base candle | 12 | Search window before the break bar |
| Base candle | Nearest candle of the other colour | Or: other-colour candle where the move began |
| Zone covers | Whole base candle | Or: body only, or body plus the far-side wick |
| A zone is tested when | Price reaches the near edge | Or: the middle, or the far edge |
| A zone is broken when | A bar closes beyond the far edge | Or: a wick goes beyond the far edge |
| Live zones kept per side | 12 | 0 = no limit; the oldest of a side is dropped |
| Only zones in the validated trend | false | Demand in an uptrend, supply in a downtrend |
| Minimum reward-to-risk of a zone | 0 (off) | Hides zones whose reward-to-risk is lower |
| Show the zones left out, show the trend | false, false | Faded outlines for filtered zones; the validated trend as a corner label |
| Keep tested zones | true | Dashed outline |
| Keep broken zones | false | Grey, up to the bar that broke them |
| Middle line, labels, mark the swing | true, true, false | Display options |
| Draw zones made within this many bars | 1000 | Drawing range |
| Draw at most this many zones | 60 | Newest first |
| Extend live zones this many bars | 15 | Right edge past the last bar |
| Fill fresh zones, colours | true | Demand, supply and broken colours |
| Pop-up alert | true | Terminal alert window |
| Play a sound / sound file | false / alert.wav | File from the terminal's Sounds folder |
| Push notification | false | Needs your MetaQuotes ID in Options |
| false | Needs e-mail set up in Options | |
| Alert: new zone / fresh zone tested / zone broken | true / true / false | Which events alert |
| Debug log for bug reports | false | Writes extra lines to the Experts tab, to attach when you report a problem |
Install from source. Copy mql5/Indicators/DisplacementOrderBlocks/ into <terminal data folder>/MQL5/Indicators/
(MT5) or mql4/Indicators/DisplacementOrderBlocks/ into <data folder>/MQL4/Indicators/ (MT4), open
DisplacementOrderBlocks.mq5 or .mq4 in MetaEditor and press Compile (F7). Both compile with 0 errors and 0 warnings
(checked with MetaEditor on a Windows machine; the compiled files are not in the repository). Keep the files of each
edition together: the indicator includes DzEngine.mqh, DzDraw.mqh and SignalAlerts.mqh from its own folder. The debug log needs the Chart Kit file as well: copy mql5/Include/ChartKit/ (MT5) or mql4/Include/ChartKit/ (MT4) into the Include folder of the data folder.
Run the Python reference and the tests
python3 -m venv .venv && . .venv/bin/activate && pip install -r requirements.txt
import sys; sys.path.insert(0, "tests")
import numpy as np
from reference import dz_zones
# t, o, h, l, c are arrays of bar times and OHLC, oldest first; the last bar is the forming bar and is not used
buffers, zones, breaks, live, atr = dz_zones(t, o, h, l, c, swing=3, body_pct=55.0)
# buffers["dem_top"], ["dem_bot"], ... are the 13 buffers; zones[k]["state"] is 0 fresh, 1 tested, 2 broken, 3 dropped
To repeat the parity check on your own data:
- Compile the indicator and the test tool for your platform (
tests/mql5/Scripts/DumpIndicator, ortests/mql4/DisplacementOrderBlocksDump.mq4withtests/mql4/Include/IndTest4/Dump4.mqhin yourMQL4/Include/IndTest4/; MT5 also needstests/mql5/Include/IndTest/Params.mqh). - Run it for each symbol and timeframe, with the input sets in
tests/configs.tsv(MT5) /tests/mql4/configs.tsv(MT4). The tool writes one CSV per symbol and timeframe with the 13 buffers (b0tob12). python3 tests/check_parity.py <folder with the CSVs>(add--mt4for MT4 dumps). It prints PASS or FAIL per file and an overall result.- Repaint: run
tests/mql5/Experts/RepaintProbein the MT5 Strategy Tester (every tick); MT4 writes its repaint log with the dump.
The price dumps used for the published numbers are not in this repository (they are broker price data).
Honest limits
- Zones are descriptive, not predictive. Against randomly placed levels the real zones did not react meaningfully better (see the study above). Use them to see where a strong move began, not as a forecast.
- An indicator is not a strategy. No stop-loss, position sizing or exit rules are provided or implied. No profit or accuracy claim is made. The only numbers here are about consistency (the implementations agree, nothing repaints), frequency (zones per month) and the random-placement study.
- "Order block" is a convention, not a standard. This is one precise definition. Other tools mark different candles and will show different zones.
- Parameters were not optimised. The defaults are round numbers, not fitted to results.
- Data-dependent. The ATR is seeded from the first bars in the terminal's history, and the swing search needs history, so the first zones of a short history can differ from a longer one.
- Scope of the tests. Four symbols, three timeframes, four input sets for parity; one MT5 repaint run. The random-placement study covers eight symbols on H1 and H4 on bid bars, without spread. Other symbols and timeframes are not covered by the published numbers. The MT5 build was not run on a live chart as part of these numbers.
Licence
All files are © 2026 Allan Niñal under the PolyForm Noncommercial License 1.0.0
(source-available, not OSI open source): free for personal and other noncommercial use, not for commercial use. Each source
file has an SPDX-License-Identifier line. The rules, the code and the tests were written for this project, and no
third-party code is included. The licence text is in LICENSE. The licence applies to this source, not to
anything you build or trade with the indicator. Trading involves risk; the software is provided as is.
Website: allanninal.dev/mql5 · MT4 · allanninal.dev · Questions: message me on LinkedIn.